CASE STUDY
Optimizing our Happy Path
Upon realizing that only a small fraction of our users were utilizing our meeting software, the team employed UX tools and processes to gain insight and generate ideas for boosting engagement.
TEAM
Director of Product and Design
Lead UX
UX Designer
Front end Developer
Back end Developer
DevOps
QA
UX/UXR methods:
User interviews
Surveys
Affinity maps
Crazy 8’s
5 why’s
Usability testing
Wireframes
Userflows
Tools
Userlytics
Hotjar
Google Analytics
Zoom
Pageflows
Adobe XD
Jira
Timeframe: 7 weeks
Problem:
Only 3.6% of new users are running a second meetings
Challenges:
We had several challenges before we started this project. Firstly, our team had limited capacity as we were working on many projects simultaneously. Secondly, we had tight deadlines for researching, prototyping, testing, and developing a solution. Lastly, we didn’t have a product owner as we were in the process of hiring one.
The process
Empathizing and defining the problem
Ideating and drafting solutions
Reviewing the results and impact
Empathizing and defining the problem

Initial data
To understand where users were falling off in the meeting creation process, the team created a funnel in Google Analytics with the events that a user needed to complete in order to be considered successful.

There were two places where users were discontinuing their meeting-creating process.

66% of new users are not creating meetings

84% of users with meetings are not setting an agenda
Research process
We knew where to focus our attention, but we still didn’t know how to fix the problem.
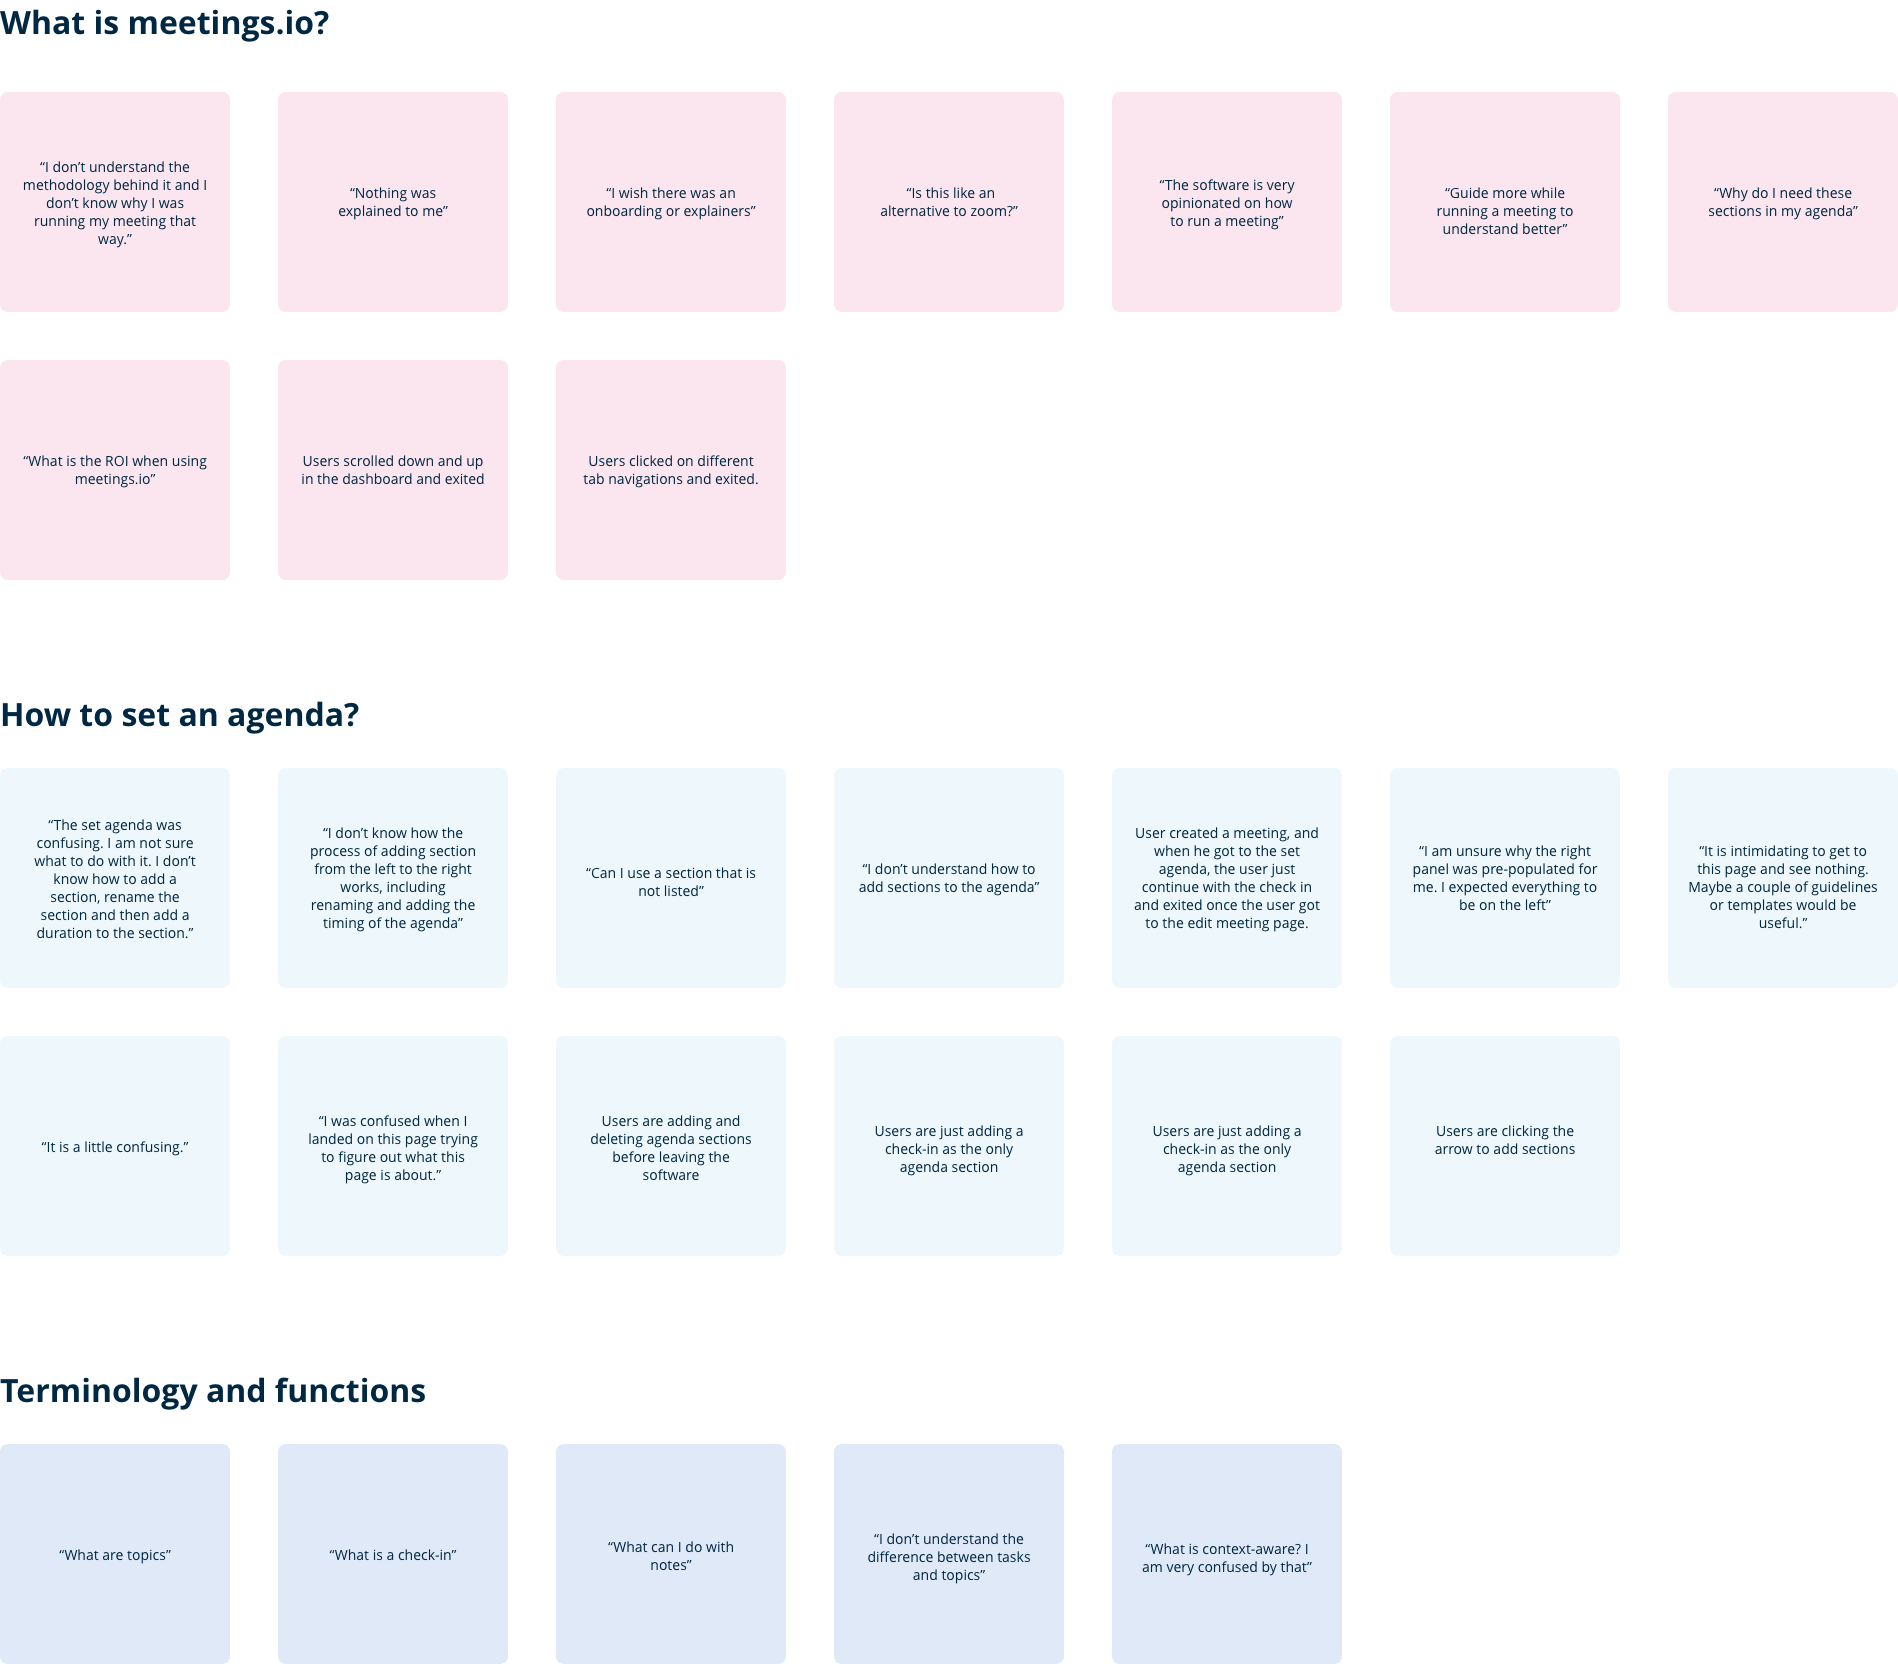
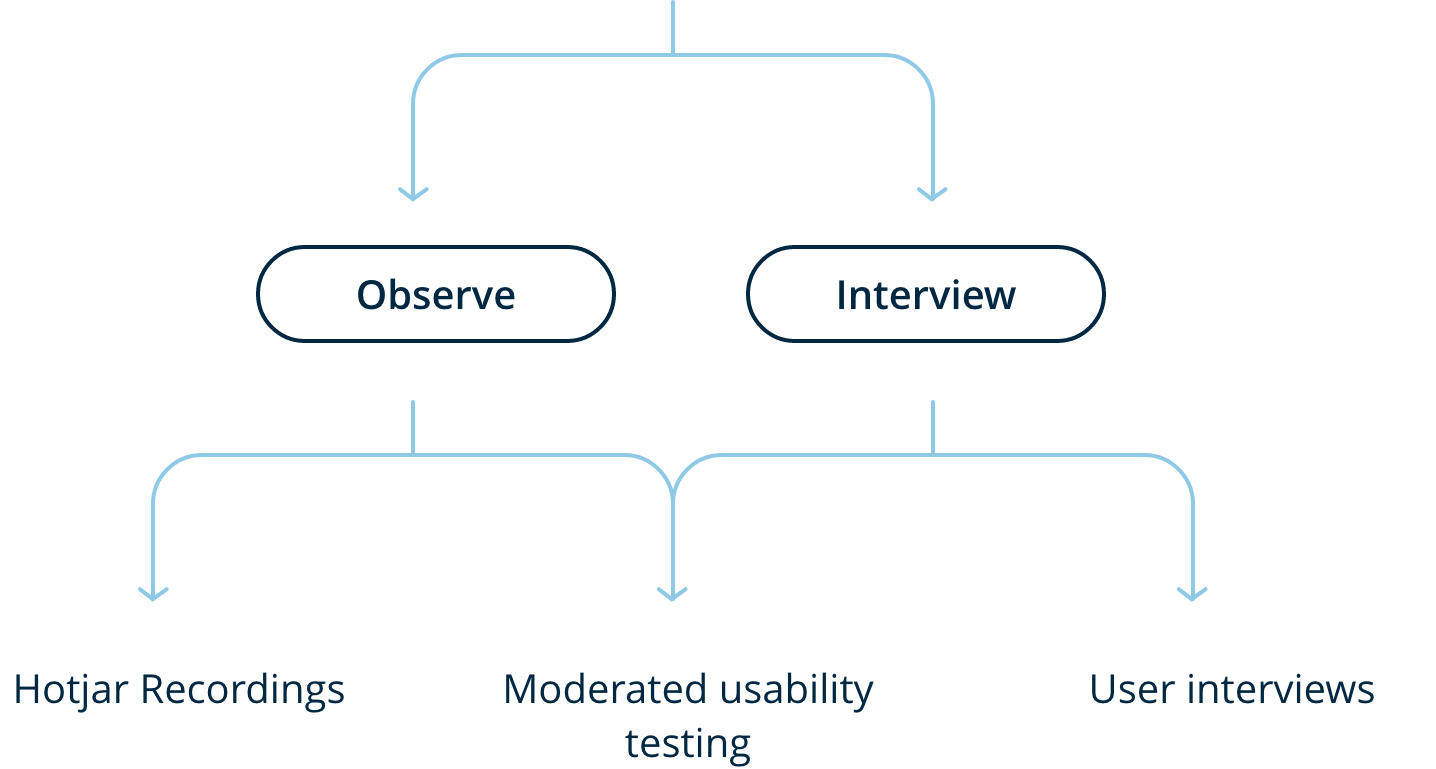
To better comprehend the problem we decided to:
Insights
For our team, it is very important to not jump into conclusions while reading feedback. To discover the core problem of each theme and get to a more truthful insight, we followed the 5-why framework.
From the themes above, these are the insights uncovered:
Insight #1: The lack of guidance and information about meetings.io prevents users from understanding the software.
Insight #2: The layout to build an agenda confuses users and prevents them from creating meaningful meetings.
Insight #3: The terminology used in meetings.io creates uncertainty about the function of sections and features preventing users from using them.
Ideating and drafting solutions
Brainstorm
With well-defined problems and with clear insights, the team got together to brainstorm possible solutions. We agreed on two projects:
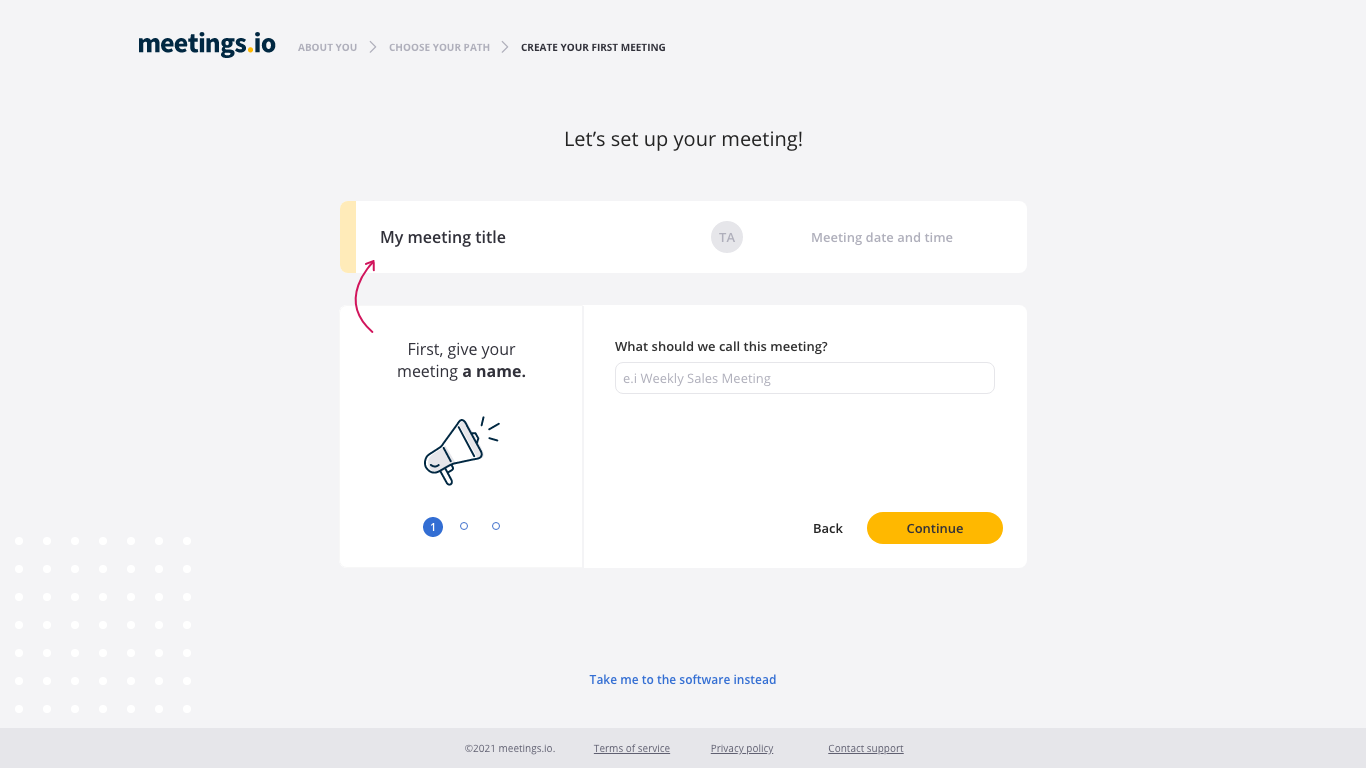
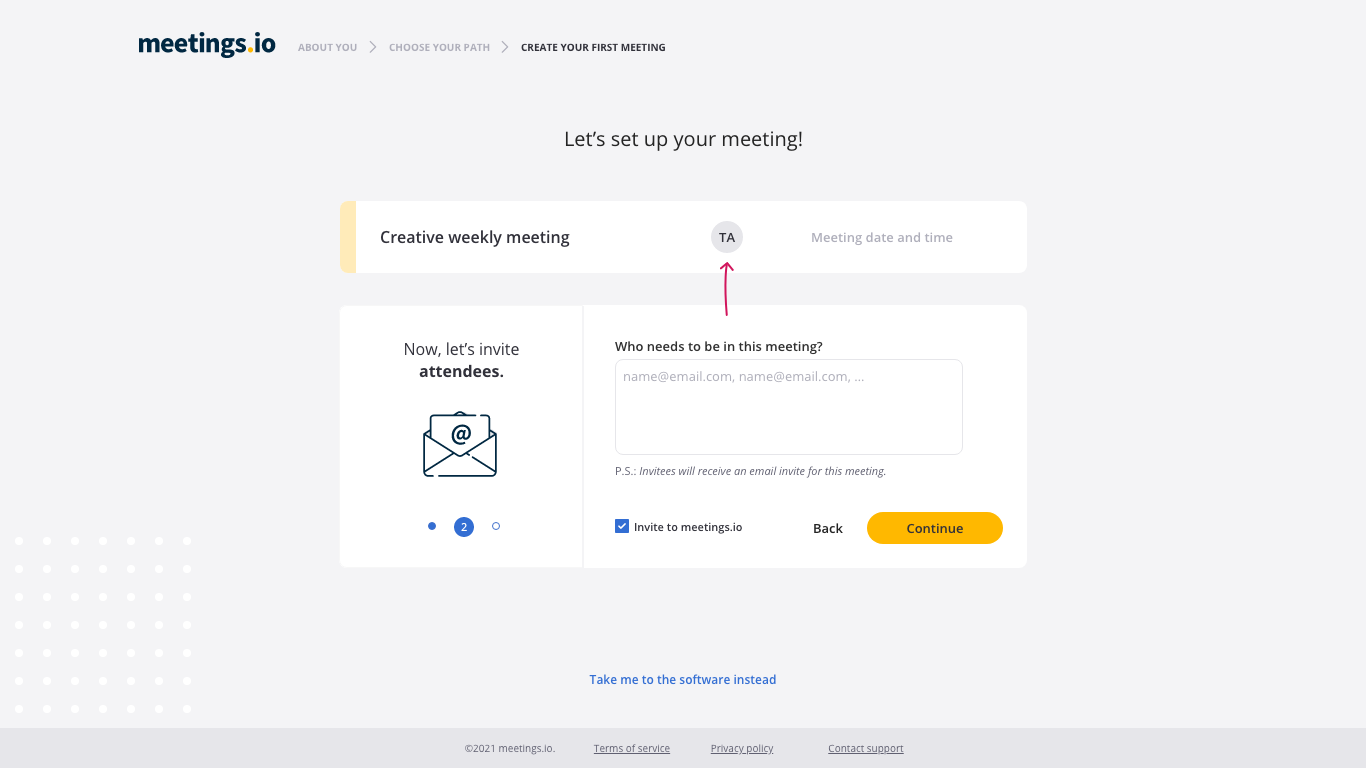
Onboarding process
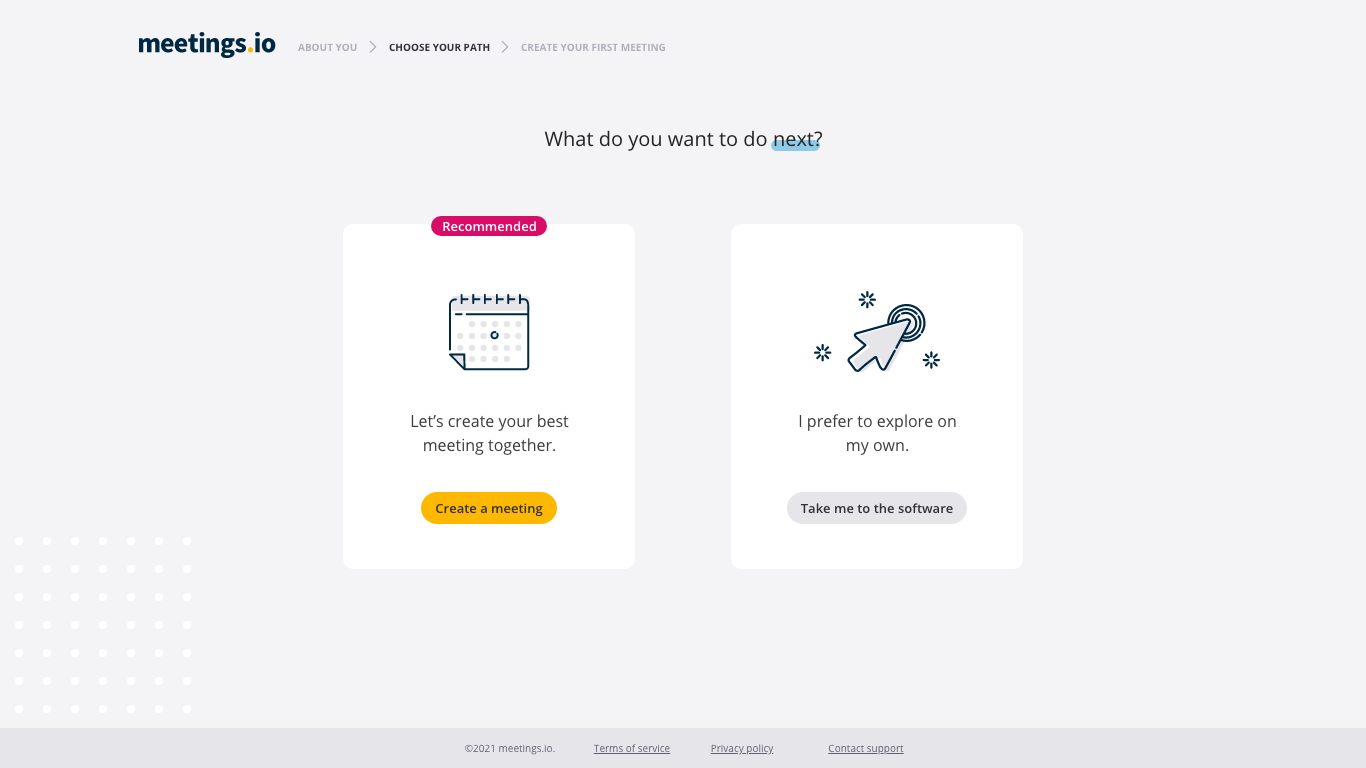
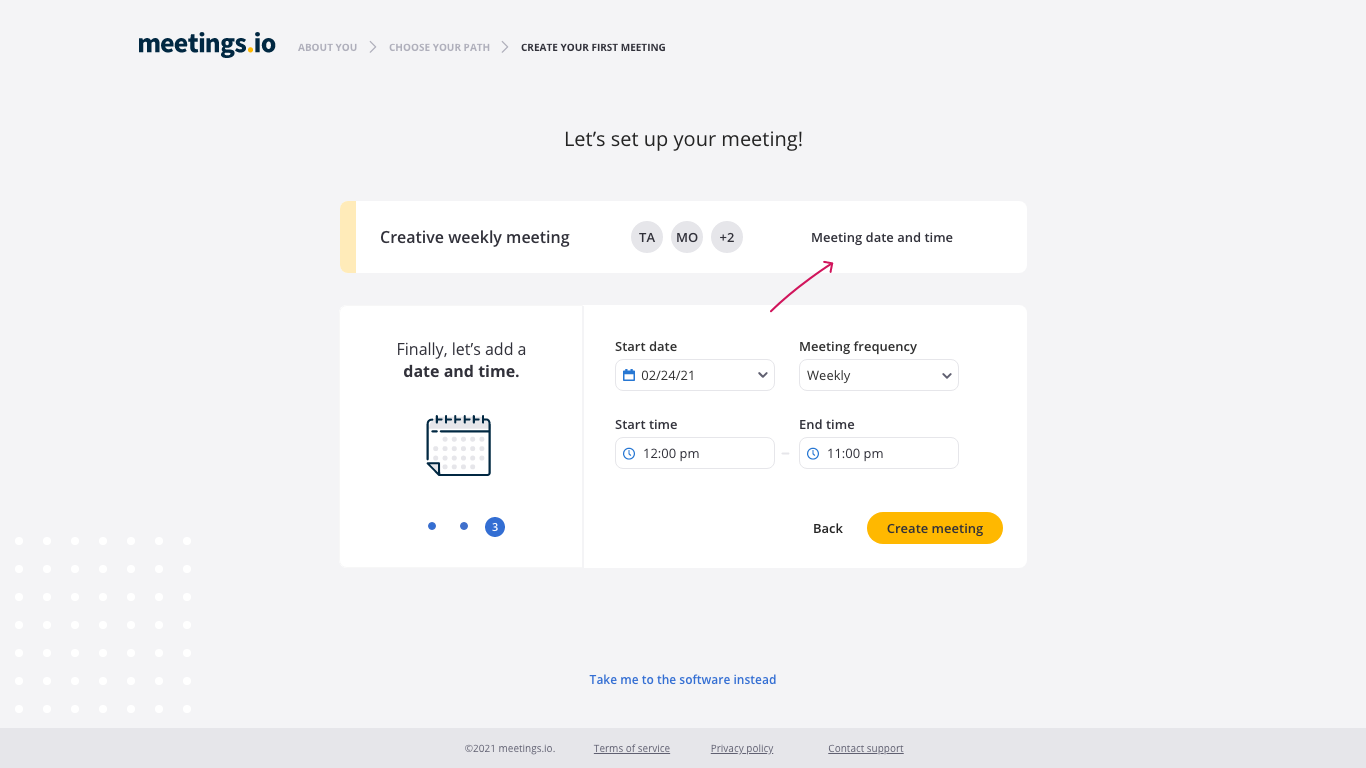
Guide our users through the meeting creating process. Let them know that we are not a video conferencing tool before they register.
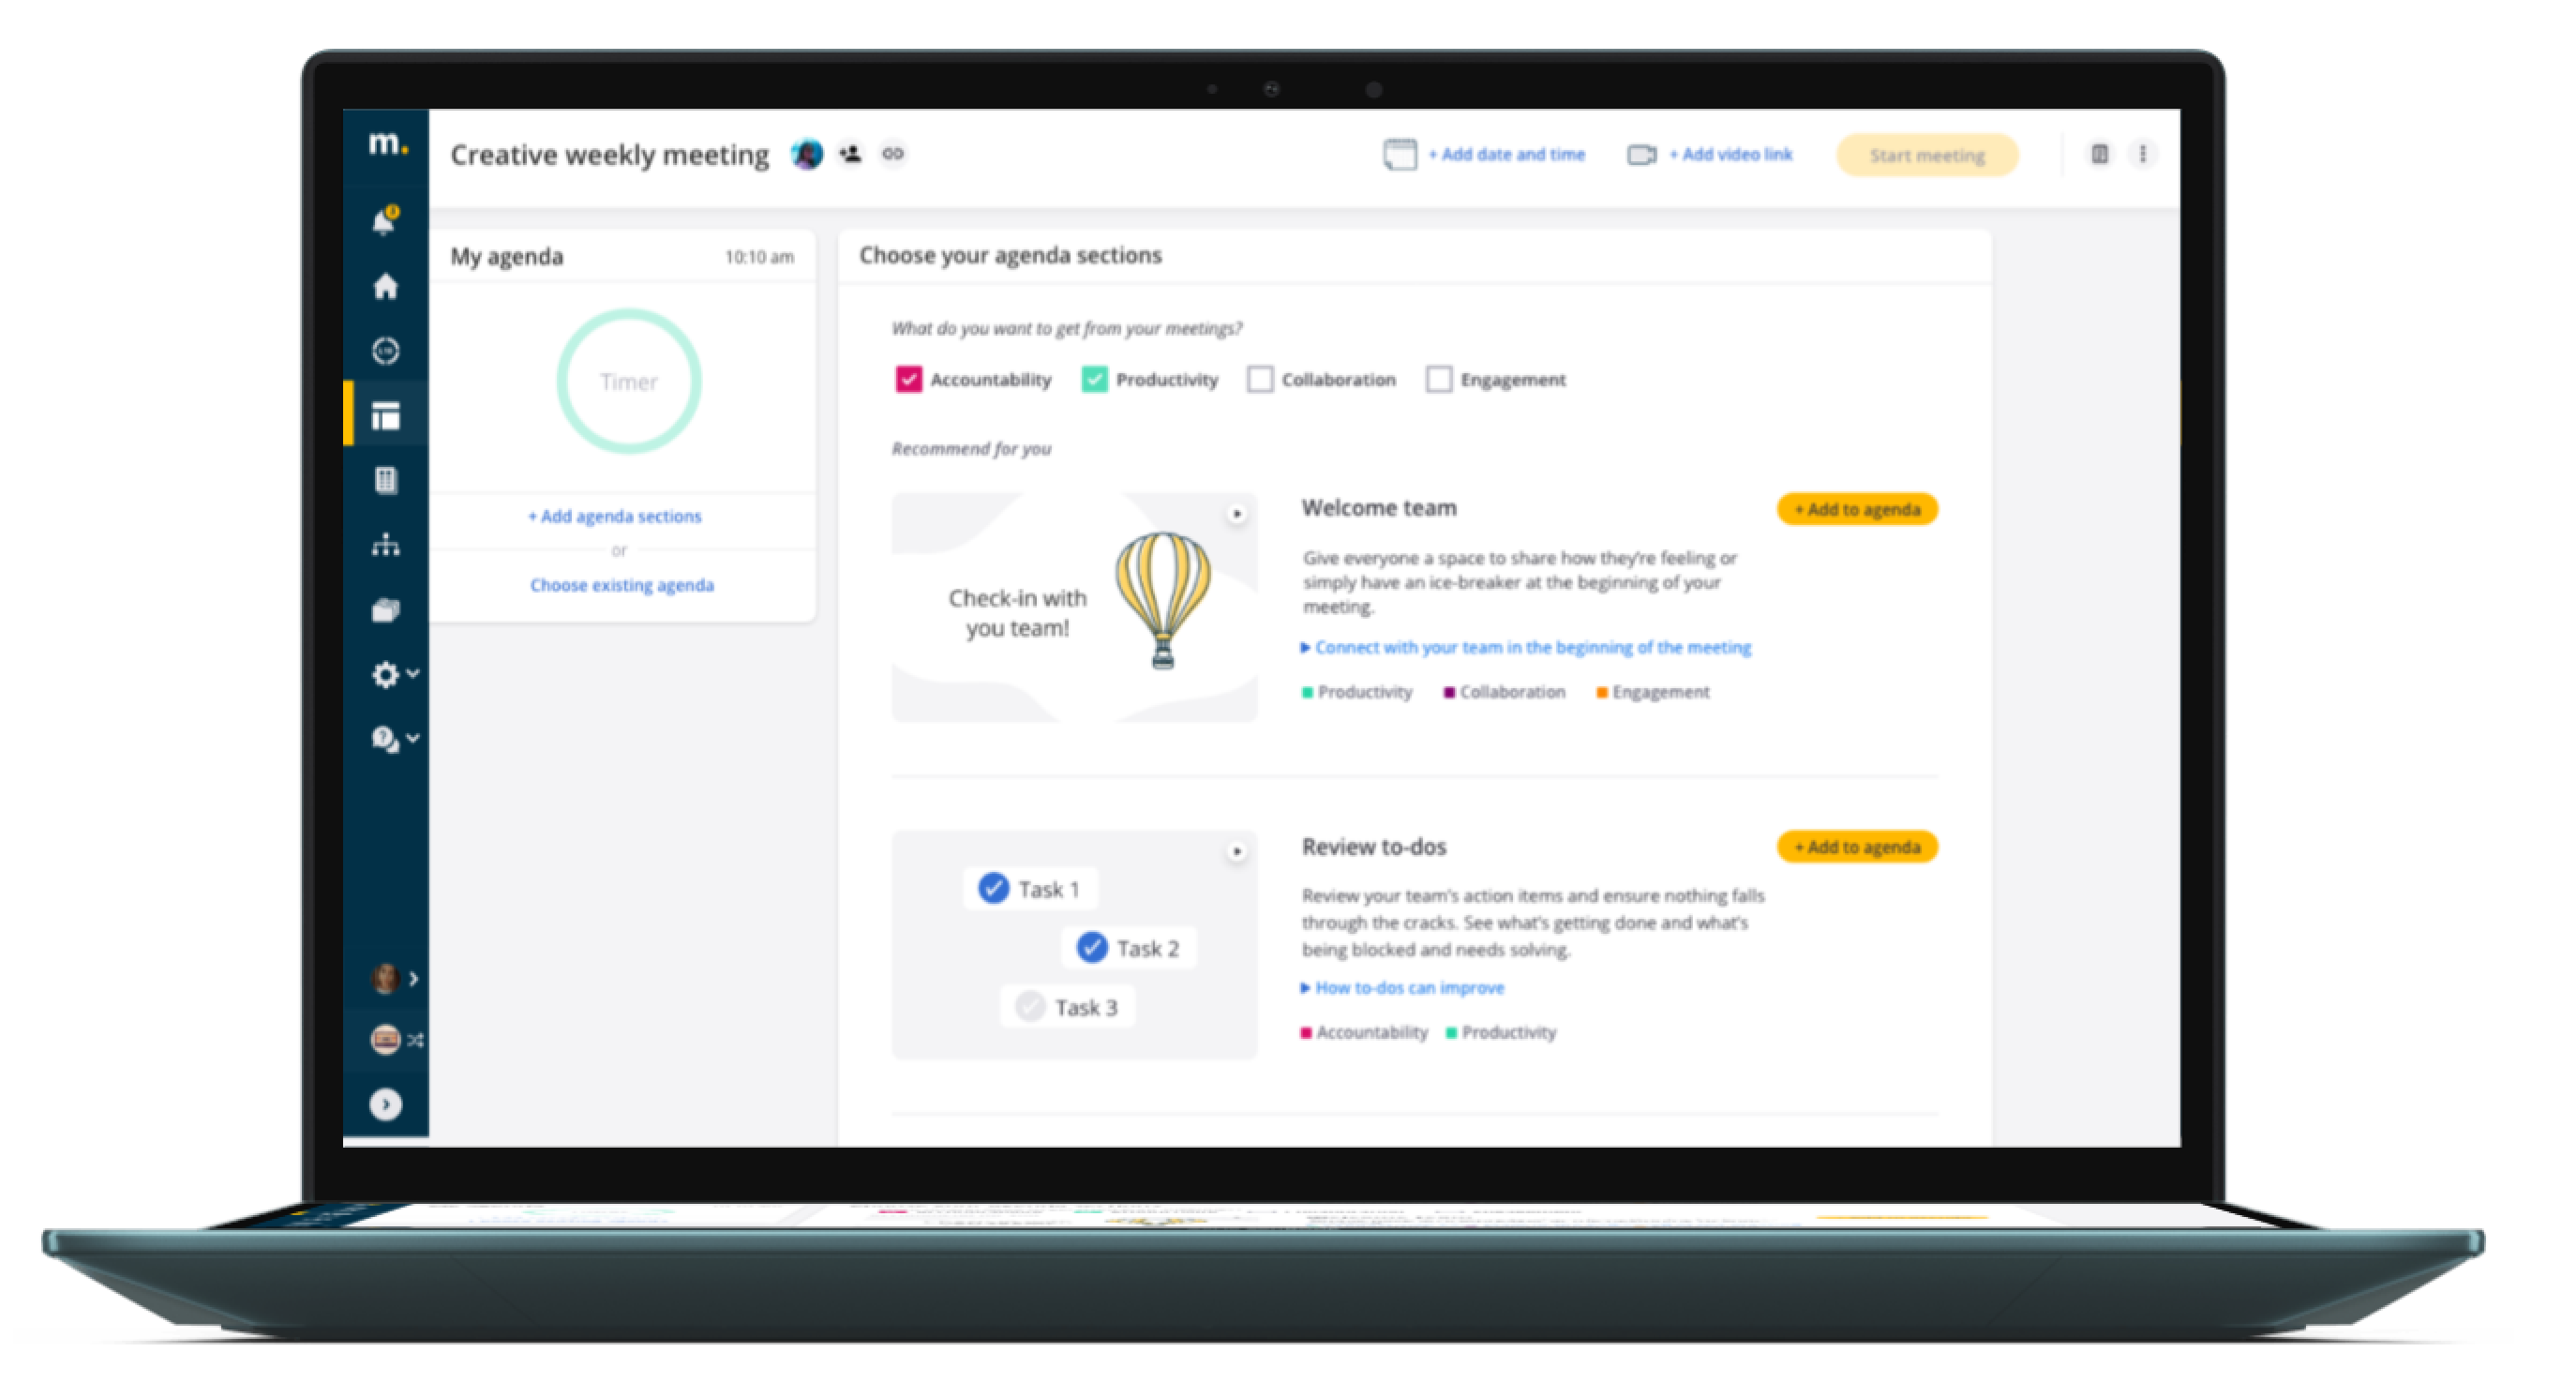
Update agenda builder
Include visuals and guides to let users know how each agenda section works in meetings.io and why they are important.
Onboarding process
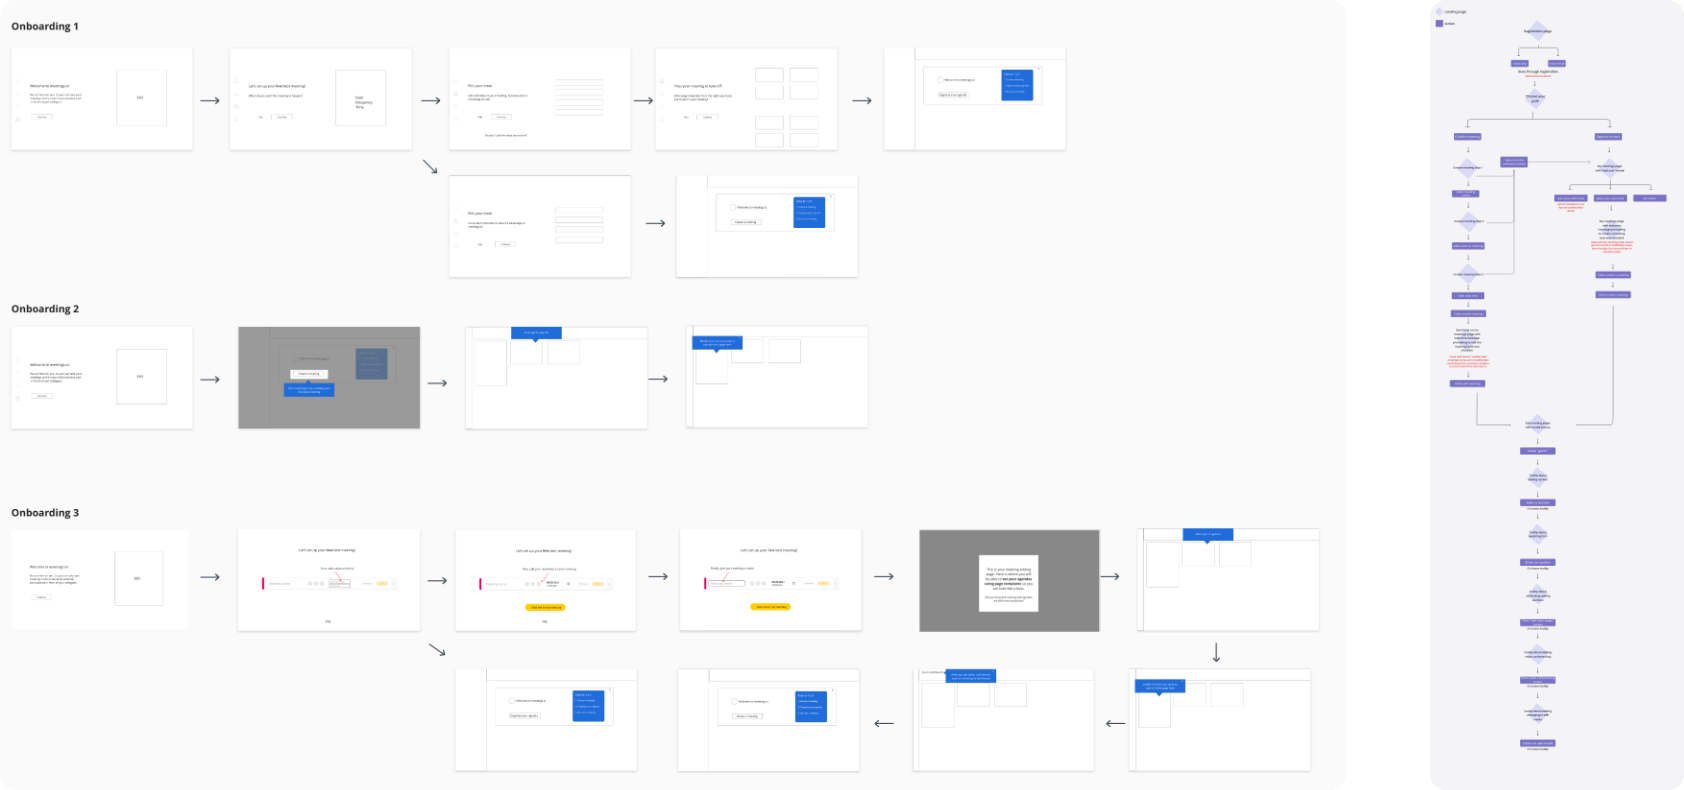
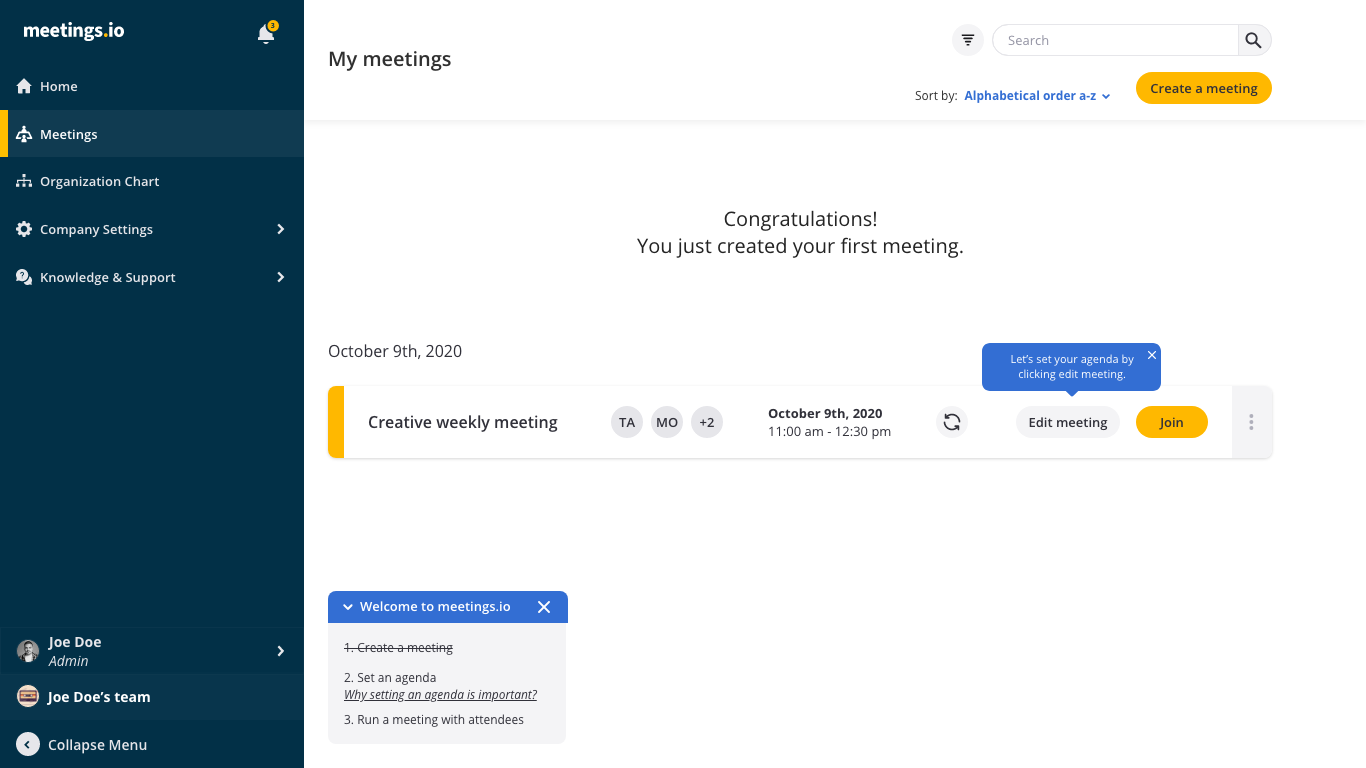
The team researched optimal onboarding flows and got inspired by looking at other onboarding ideas using Pageflows. We wireframed three different options, and after reviewing with the team, we created a completed flow and prototype.
Update agenda builder
Using a whiteboard and insights from a Crazy 8’s exercise, the team worked together to refine and enhance the agenda builder. We explored creating a white-glove experience, guiding users through each agenda section with visuals, videos, and step-by-step support.
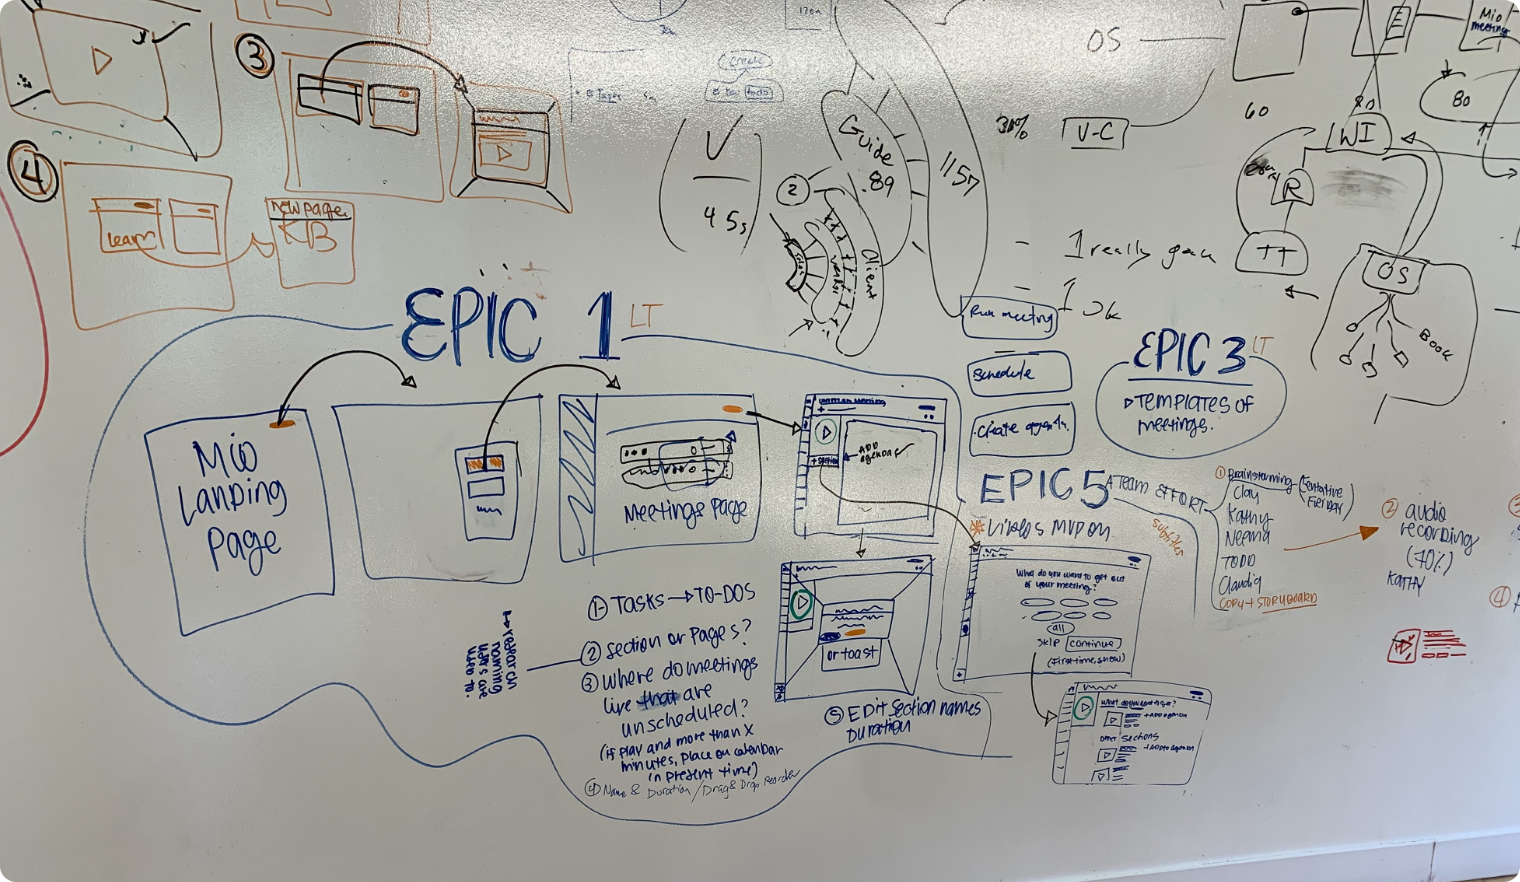
We prototyped, tested, and refined these ideas through iterative cycles. Here is the finalized design for the main screen of the agenda builder.
Reviewing the results and impact
Review and iterate
20 days after implementing the designs, we went back to user Google Analytics to review the impact of these changes.

24%
Meeting creation increased 24.4%
34%
Adding sections to an agenda increased 34.2%
6%
6.25% of new users are running a second meeting

Our users also shared excitement: “The new changes are great!” “The new agenda page is more intuitive”
There is ongoing monitoring on these two experiences via Hotjar and user interviews to understand how to continue improving them.
