CASE STUDY
Web app for food service company
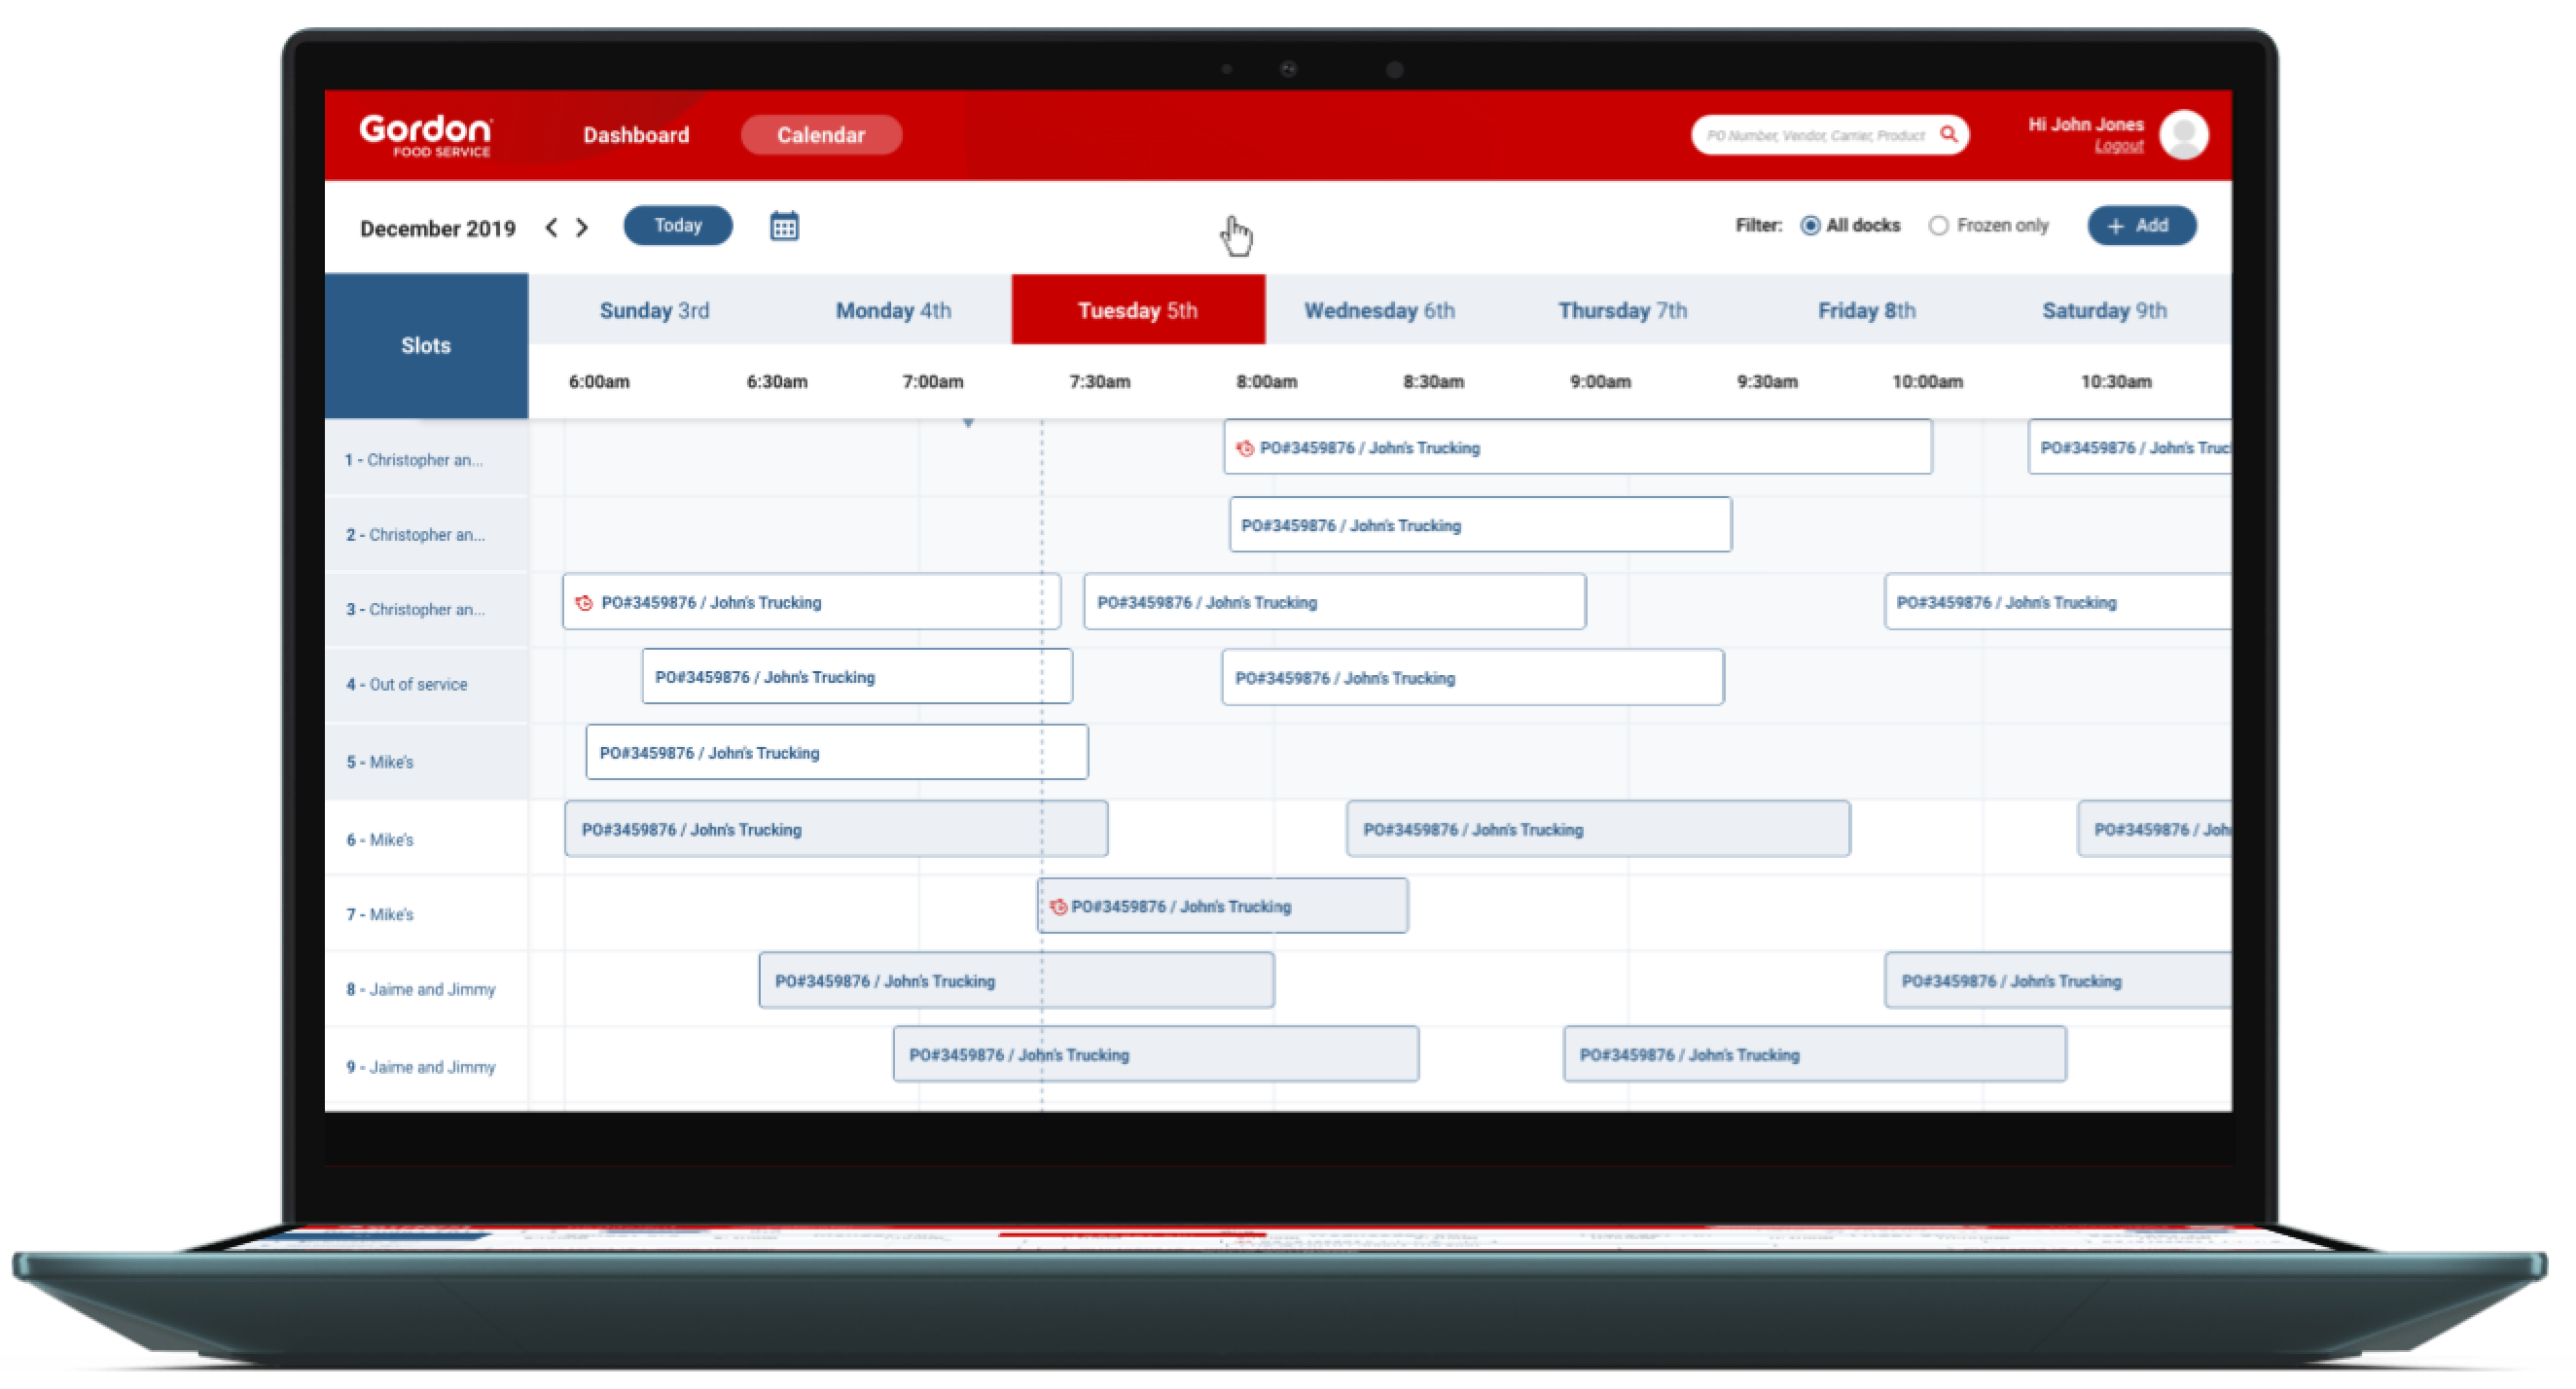
Food truck drivers delivering products to grocery stores faced a wait time of 1 to 4 hours before being assigned a slot. Discover how our scheduling solution helped accurately forecast their arrival times, resulting in a significant reduction in waiting time.
TEAM
Product Owner
Senior UX Designer
UX Designer (Me)
Front-end Developer
Back-end Developer
QA
UX/UXR methods:
Whiteboarding
Userflows
Wireframes
Prototyping
Tools
XD
Jira
Timeframe: 7 weeks
Problem:
Gordon Food Services had trouble managing warehouse scheduling and truck coordination. Inefficient processes caused delays, wasted resources, and higher costs, affecting deliveries and overall productivity.
Step #1: Empathize
Research review
Initial research was provided by the client. Three main groups were the focused of this research:
1. Stakeholders
2. Carriers and brokers
3. Vendors
In this research the team learned that:
Lack of communication between all parties involved.
Schedulers, receivers, truck drivers didn’t have an instant way to communicate with each other.
Schedulers were manually assigning slots
Scheduling a slot was a very labor intensive process.
Truck drivers were not updating their status in real time.
Many truckers were arriving at the same time increasing the wait time.
Lack of system to prioritize trucks.
Some trucks contained “hot loads” or frozen foods that required priority attention.
Overall slot capacity for the upcoming days.
Schedulers didn’t have a quick way to see what days had more availability receiver truckers.
Step #2: Define
How might we
The team got together to reframe the clients challenges as questions using the “How might we” exercise.
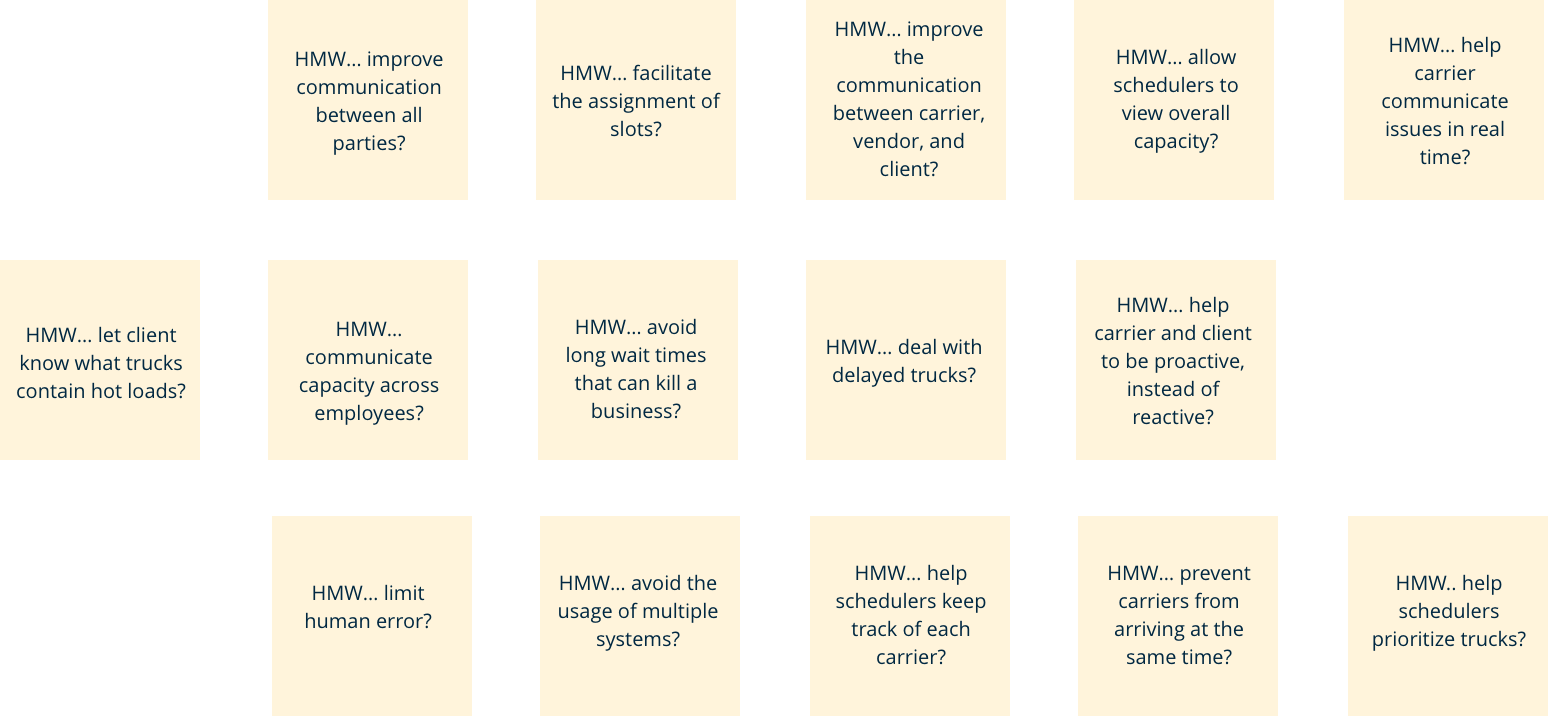
The team brainstormed possible solutions.
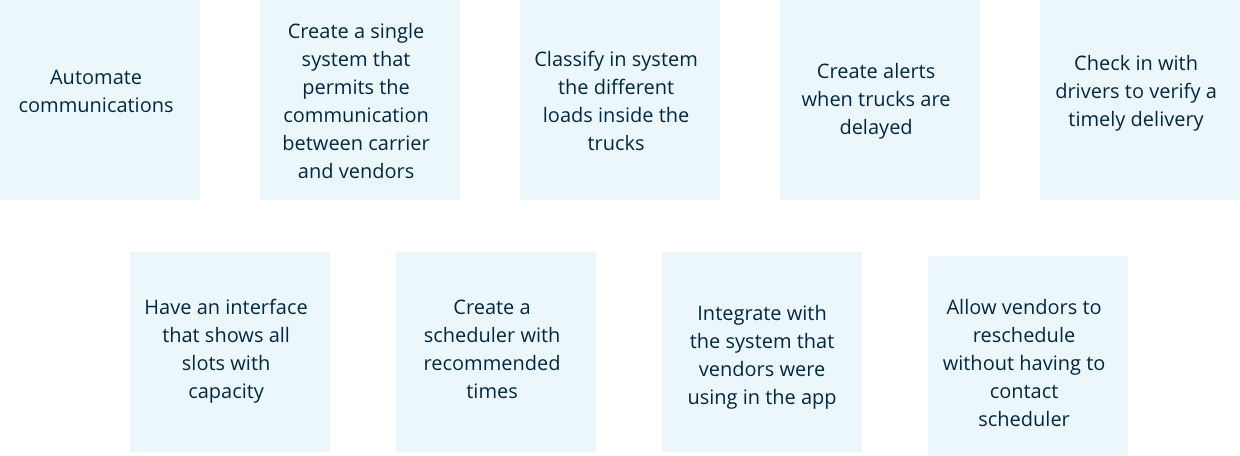
Whiteboarding for initial flow
The team collaborated using a whiteboard to create a flow that would allow to streamline the delivery updates between the carrier and vendors.
Step #3: Ideate
Wireframes
Based on the research and the initial ideas of from the How Might We exercise, we created a wireframe to share with the client and users for initial feedback.
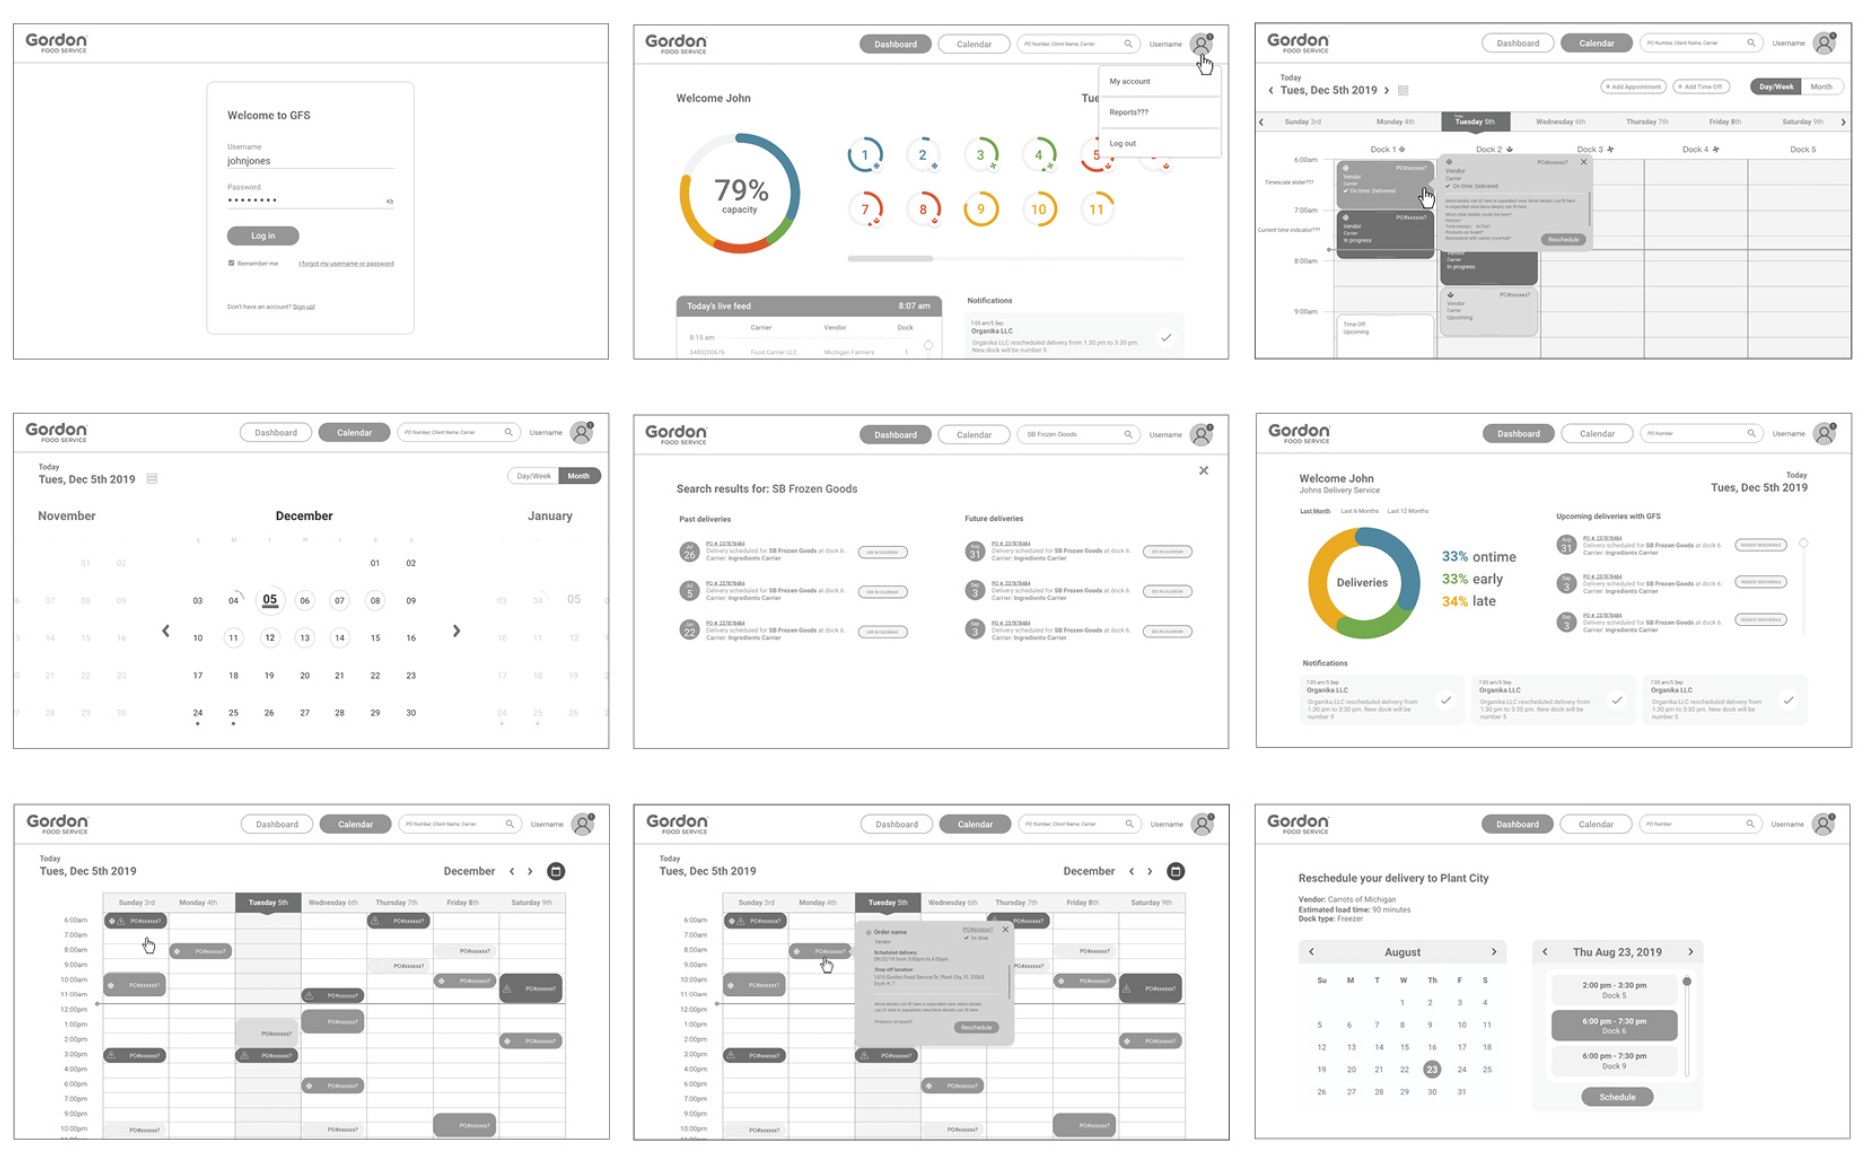
This is some of the feedback we got, and as a team came up with solutions.
Feedback
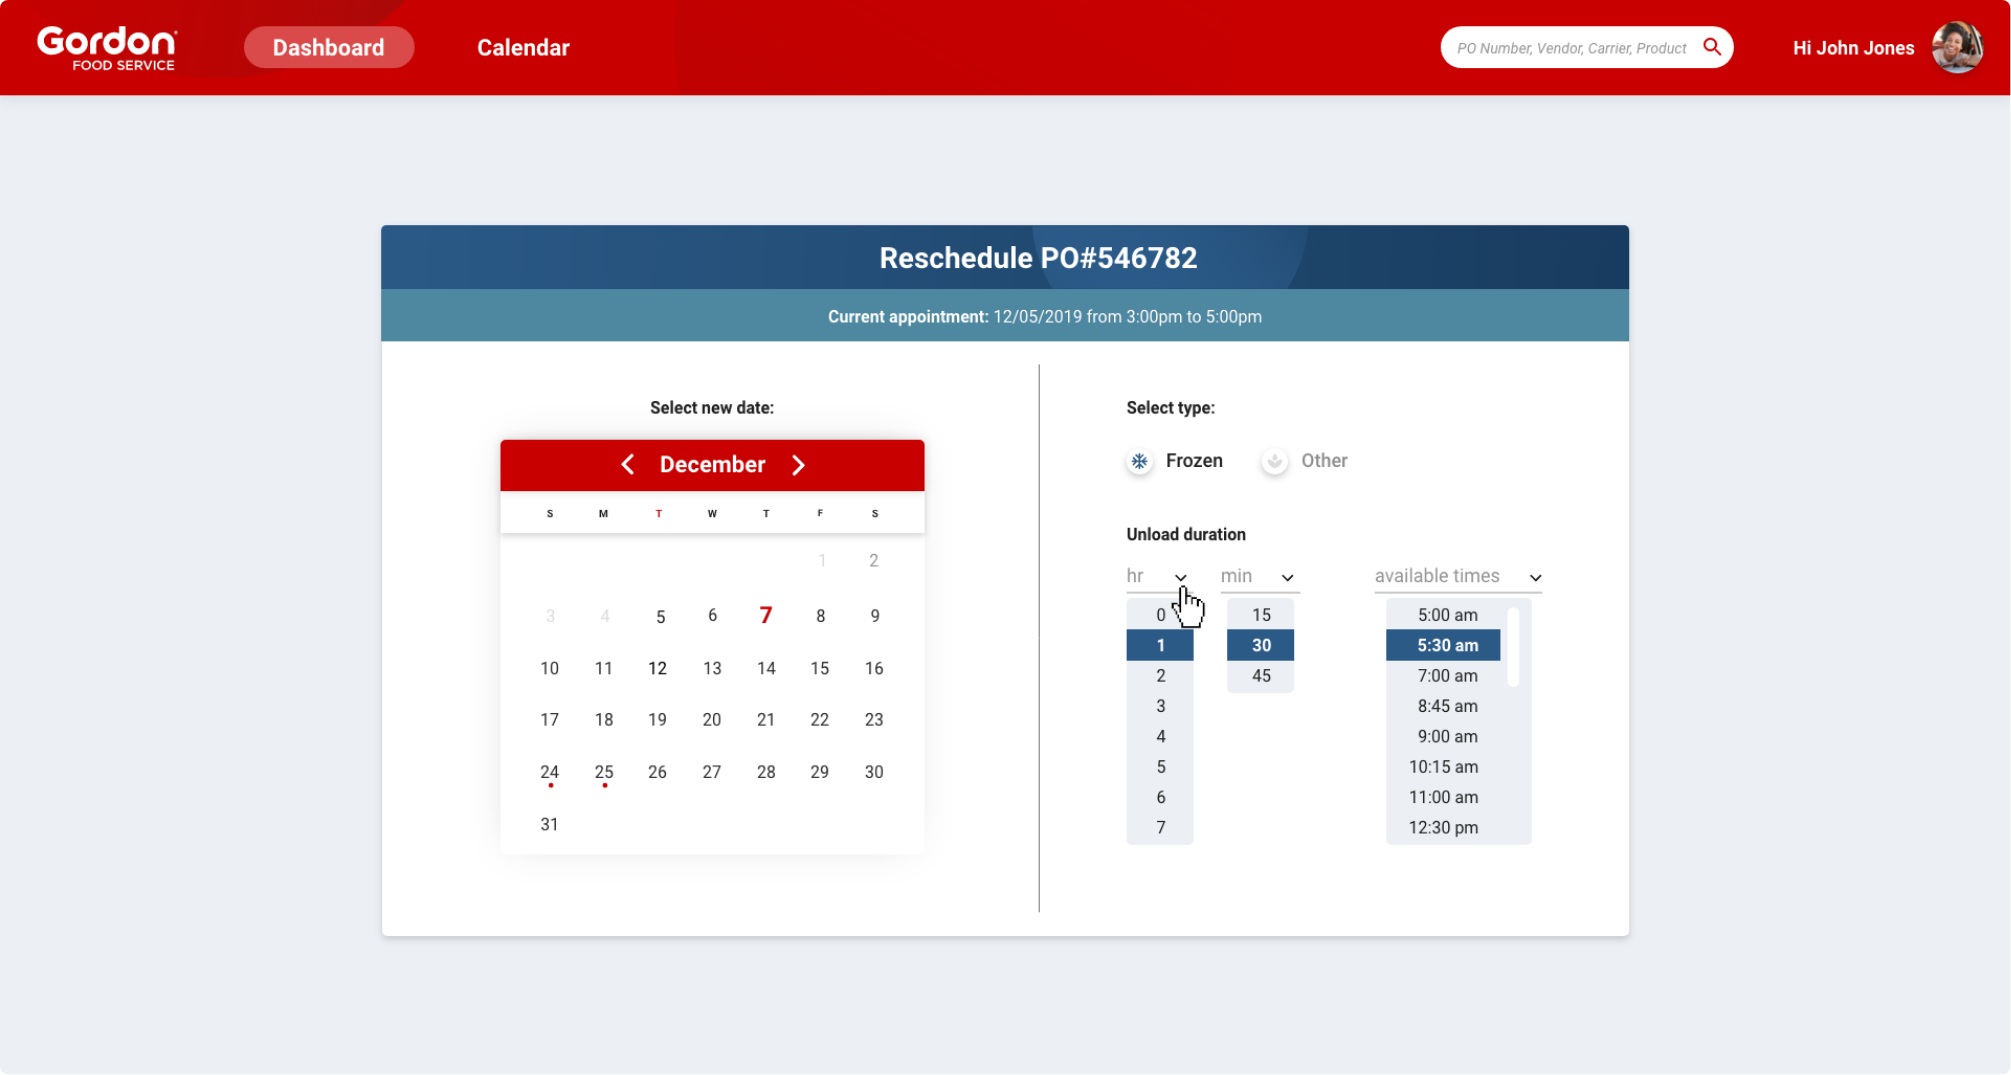
Initially we had “frozen,” “fresh food,” “hot loads,” and “regular food” as categories of the items inside the trucks. We had docks for all of those categories. However, we learned that “fresh food” like fruit and vegetables and “regular food” like cereal or cans can share the same docks and do not need separate categories. “Frozen” is the only category considered a “hot load” which indicates priority.
Solution
The team kept two categories: frozen and other. Frozen will always be the priority and the client will be able to filter by those two.
Feedback
The circles to indicate dock capacity were confusing.
Solution
We decided to stick with patterns already recognized by most people like bar charts.
Step #4: Prototype
Moodboards
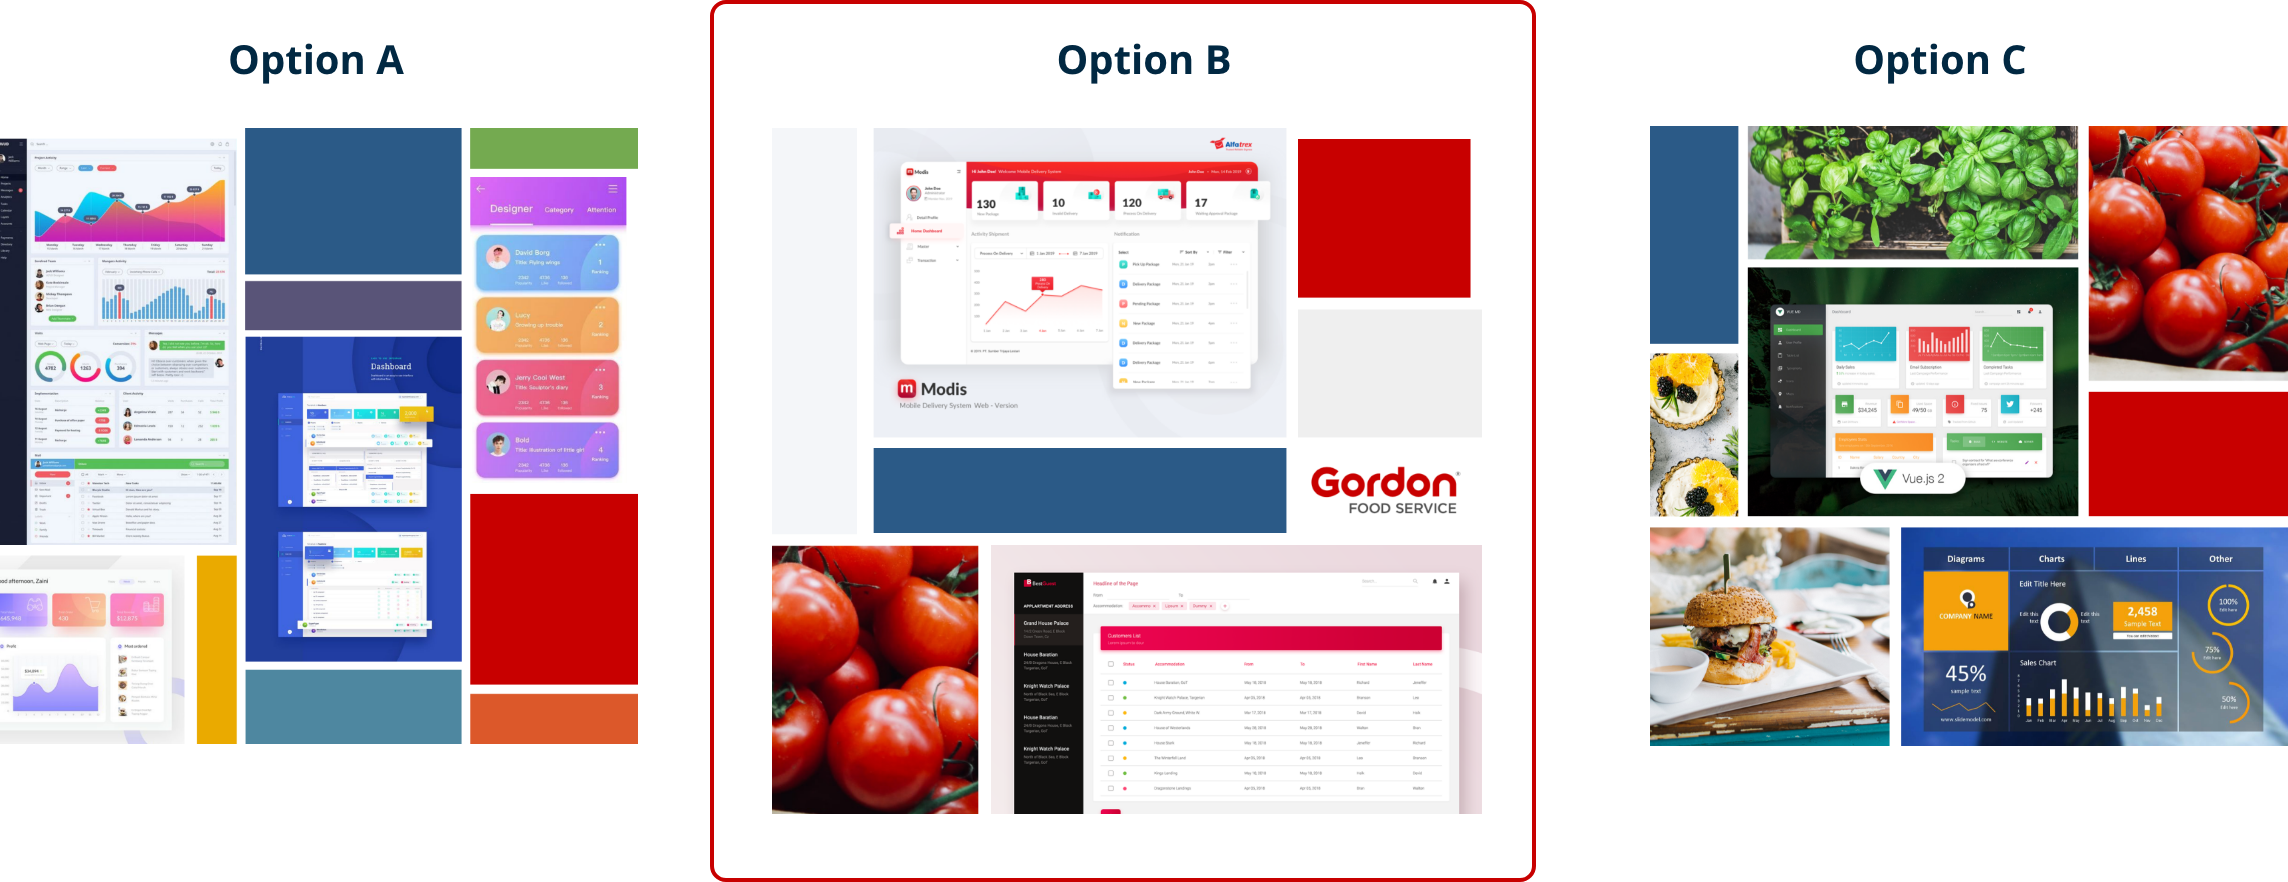
Before prototyping, the team wanted to ensure that the UI was aligned with the client’s expectations.
We shared with the client three moodboards to understand which one aligned with the brand the most. Option B was chosen.
Prototype
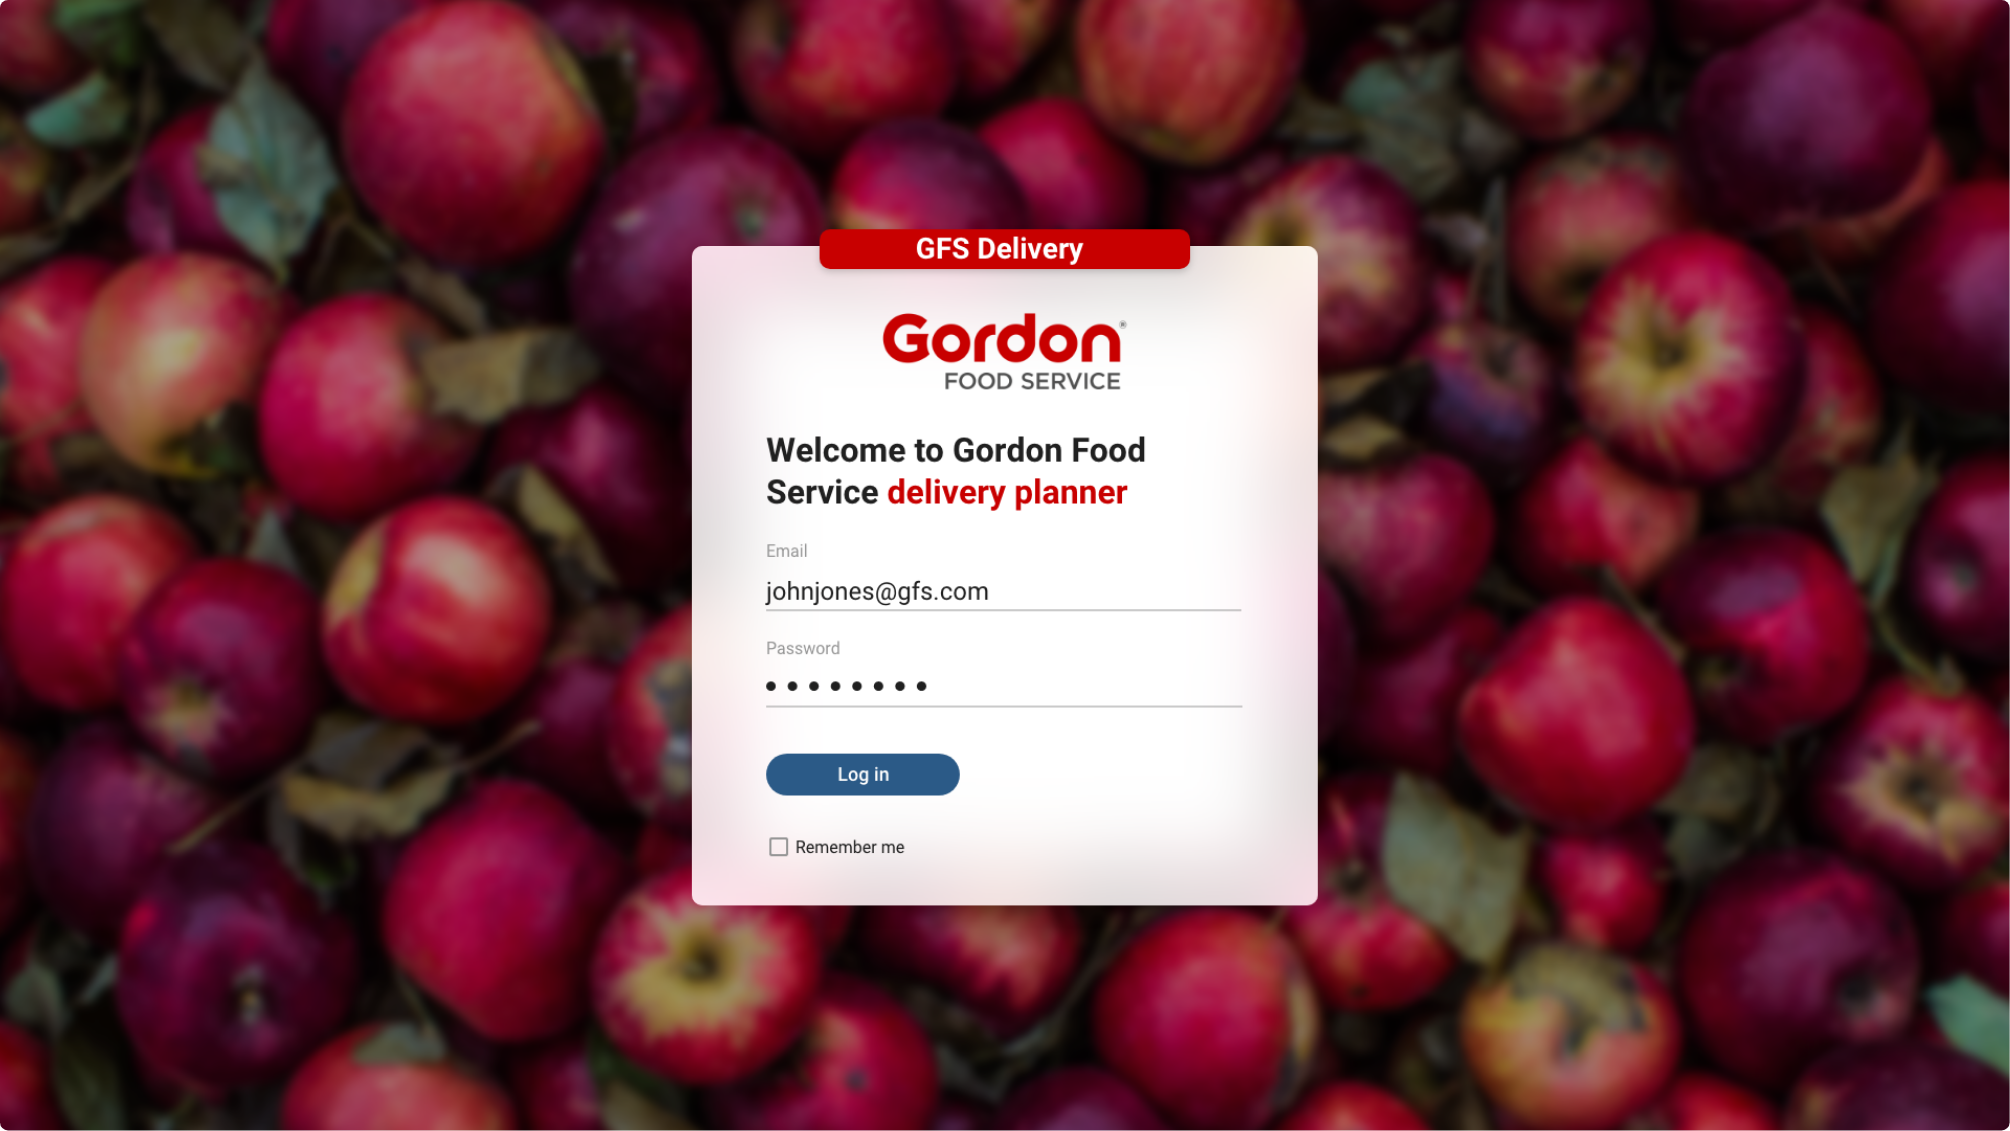
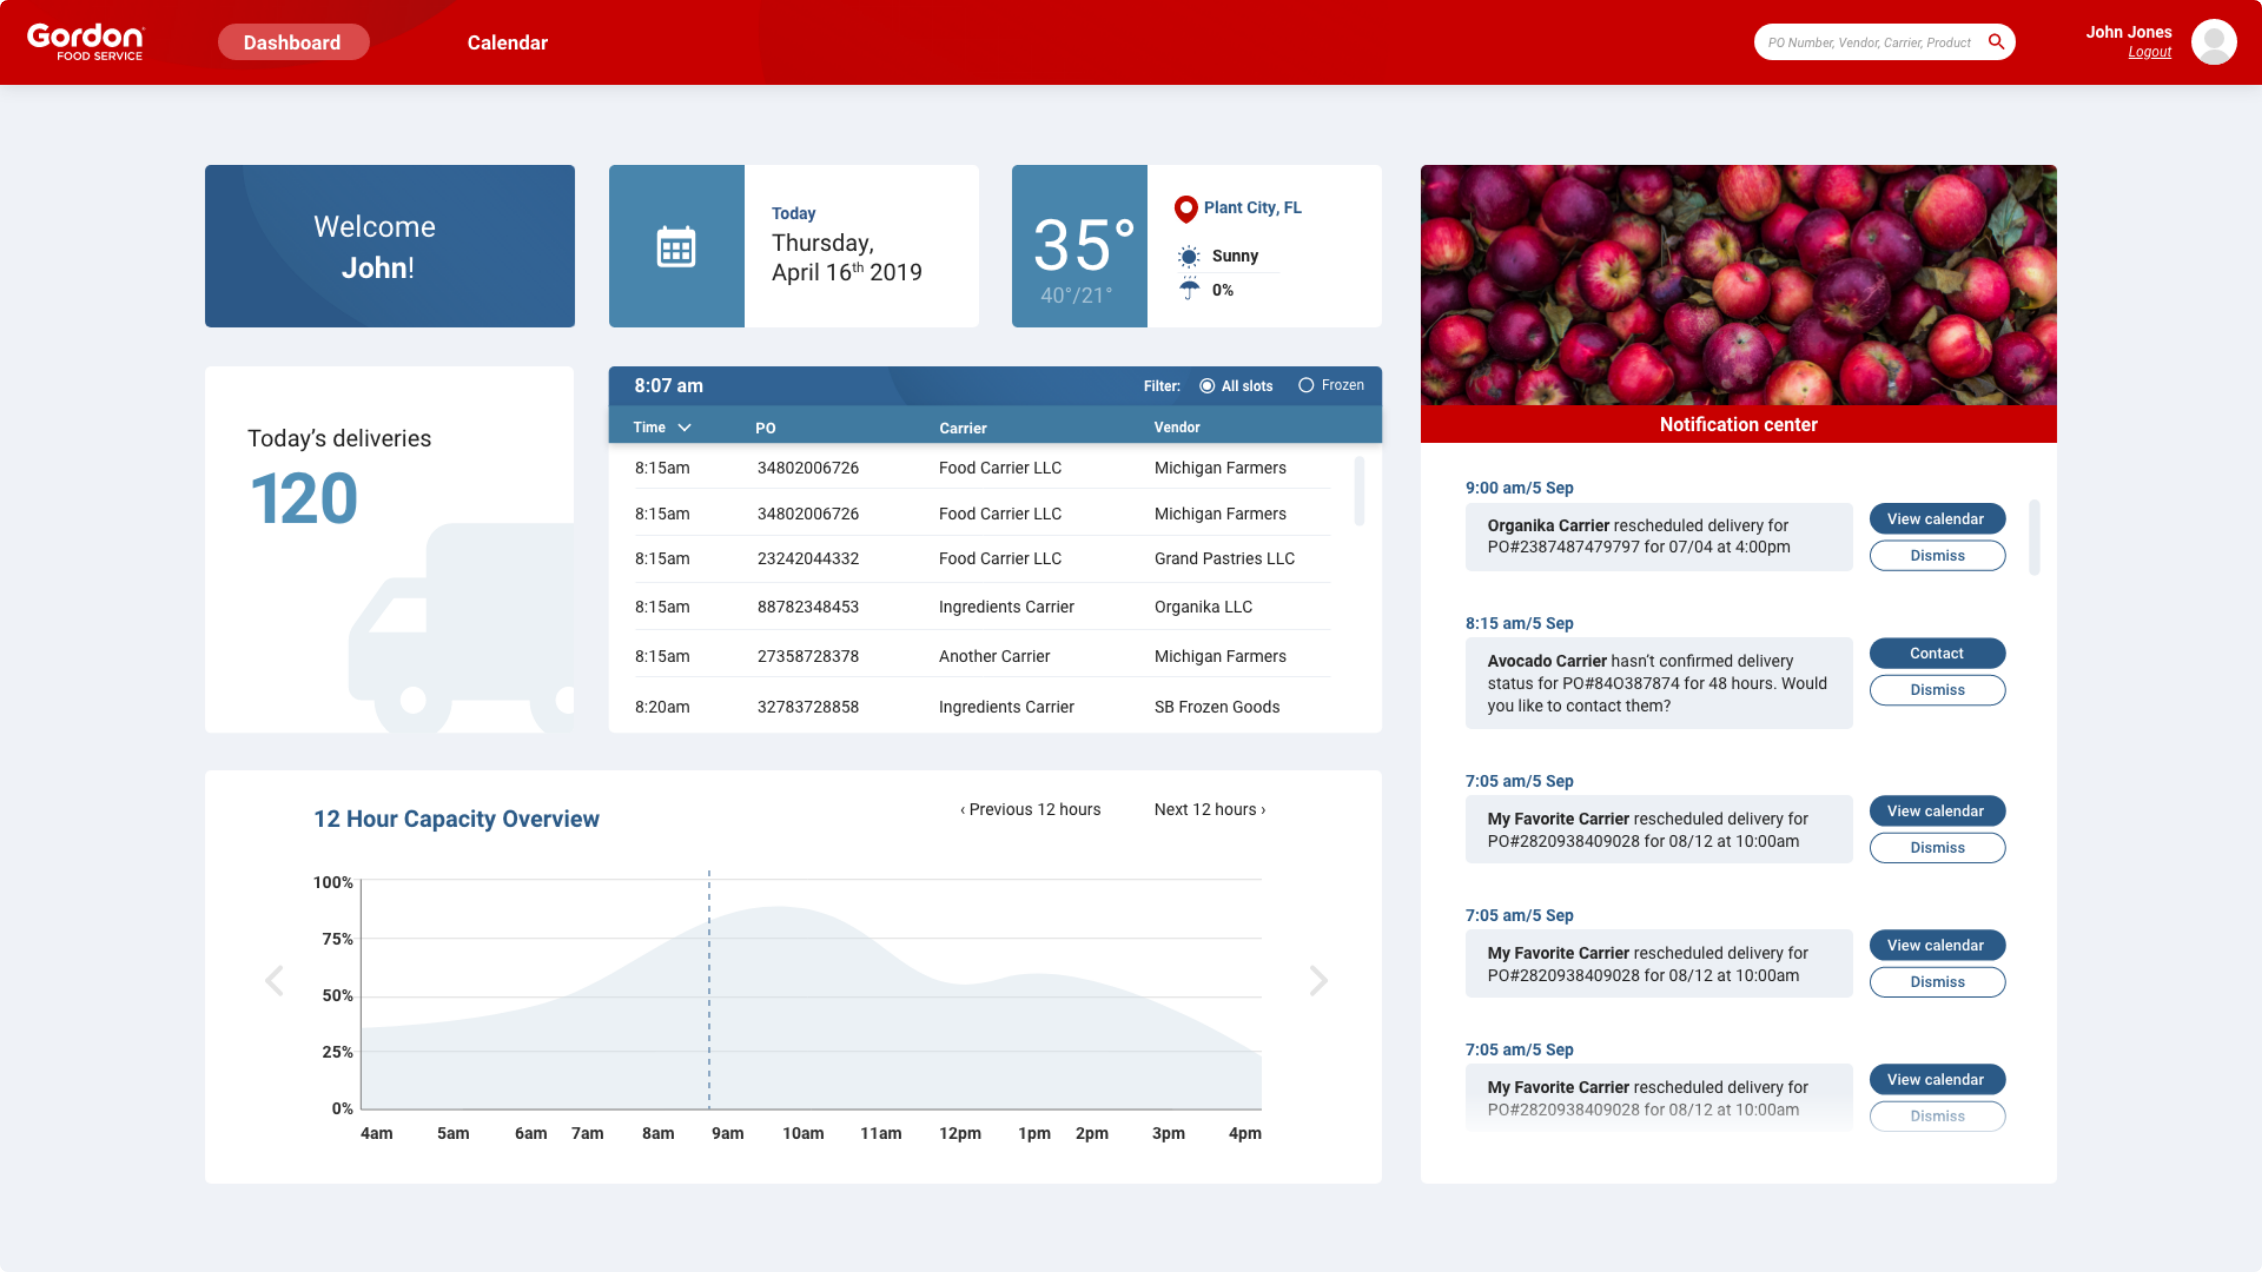
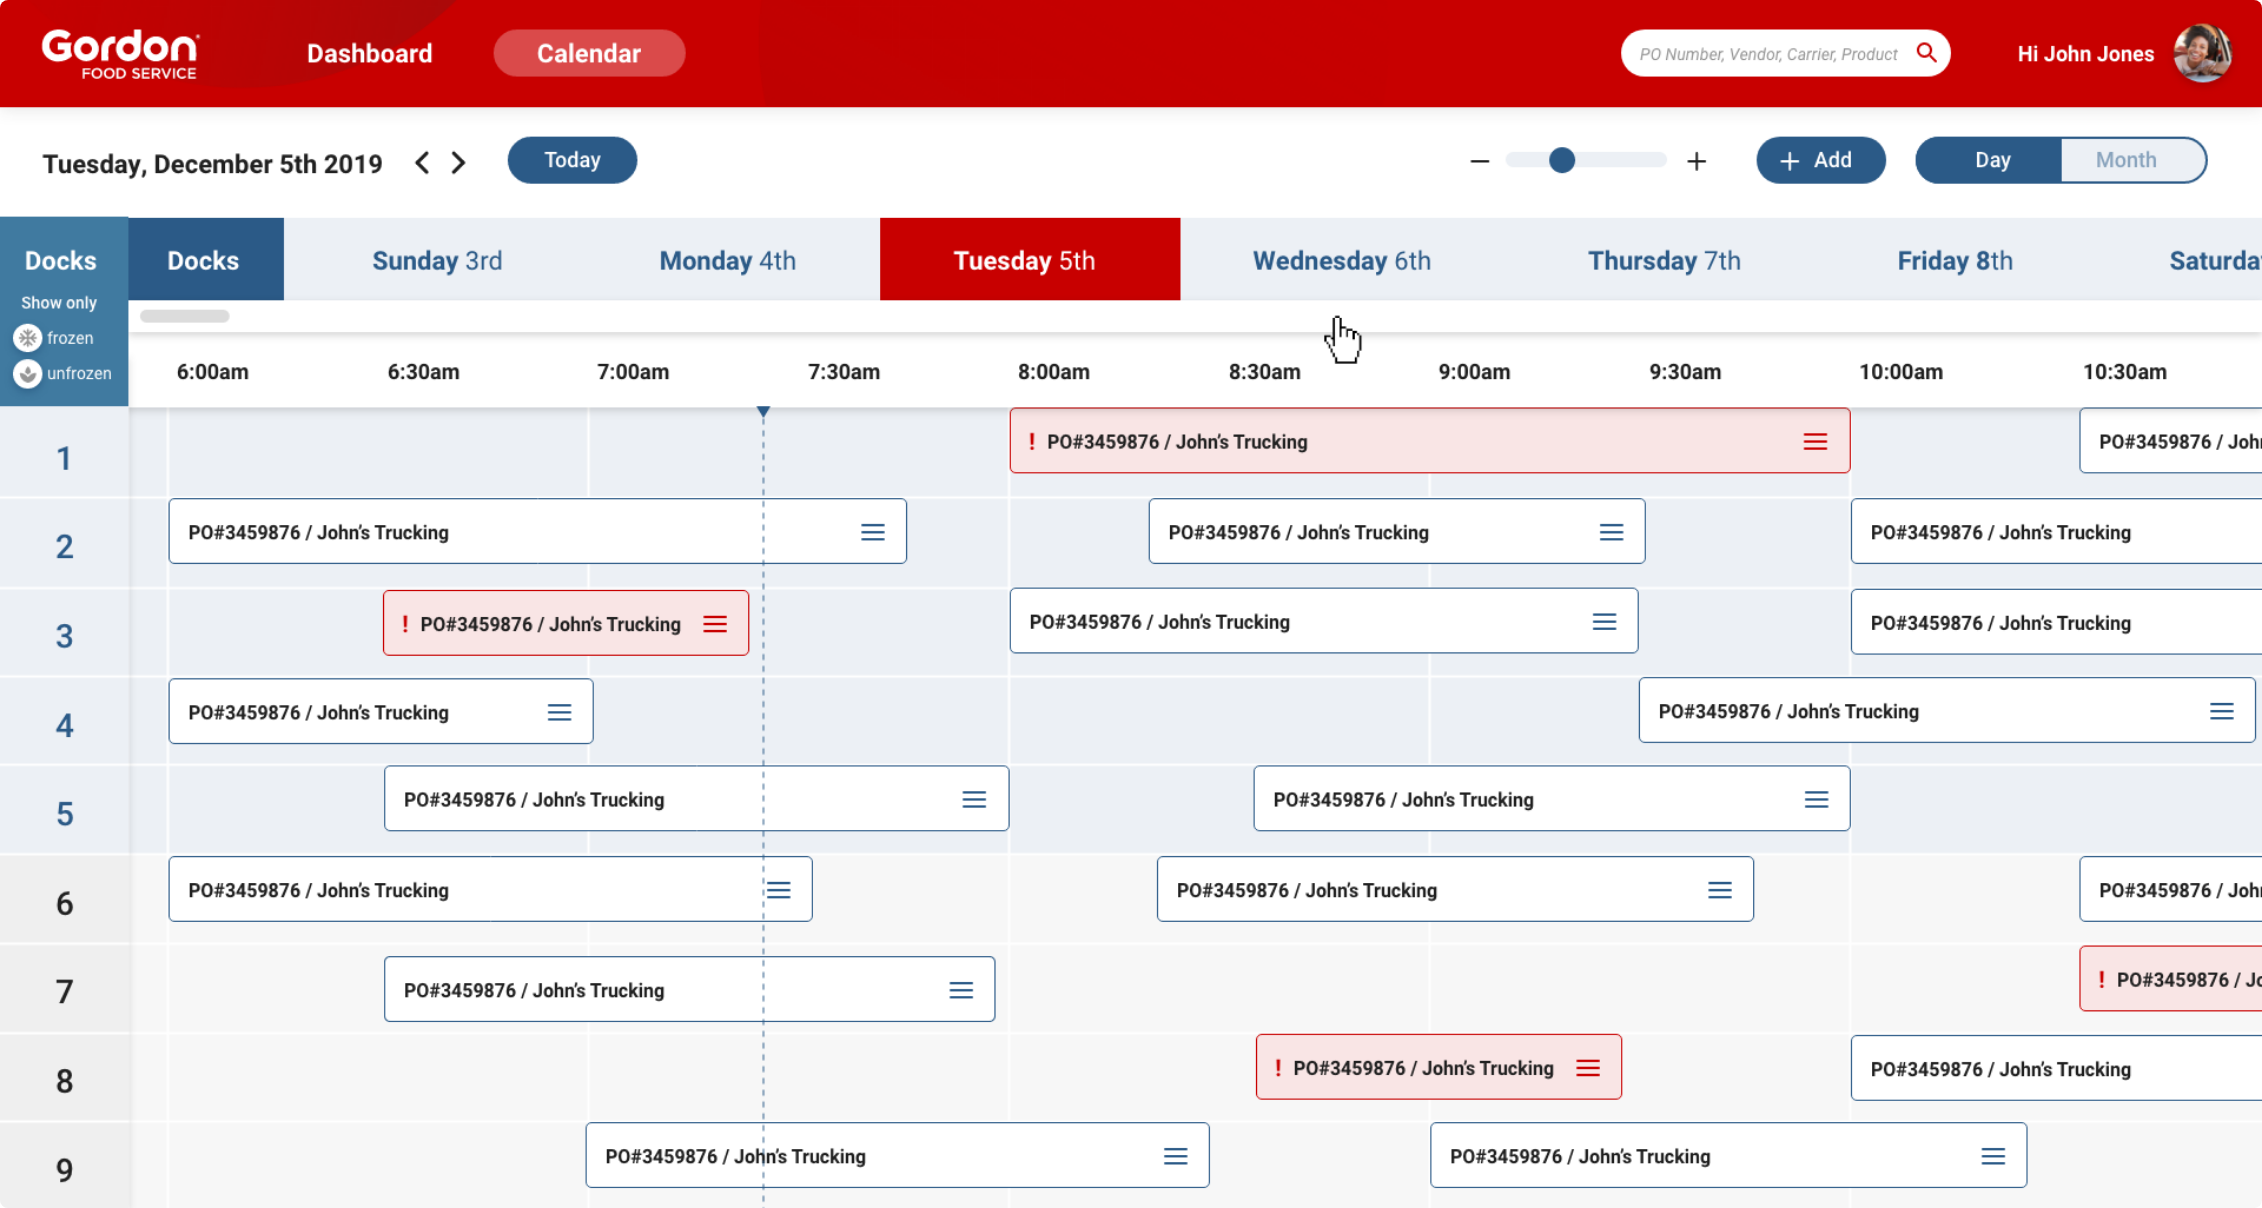
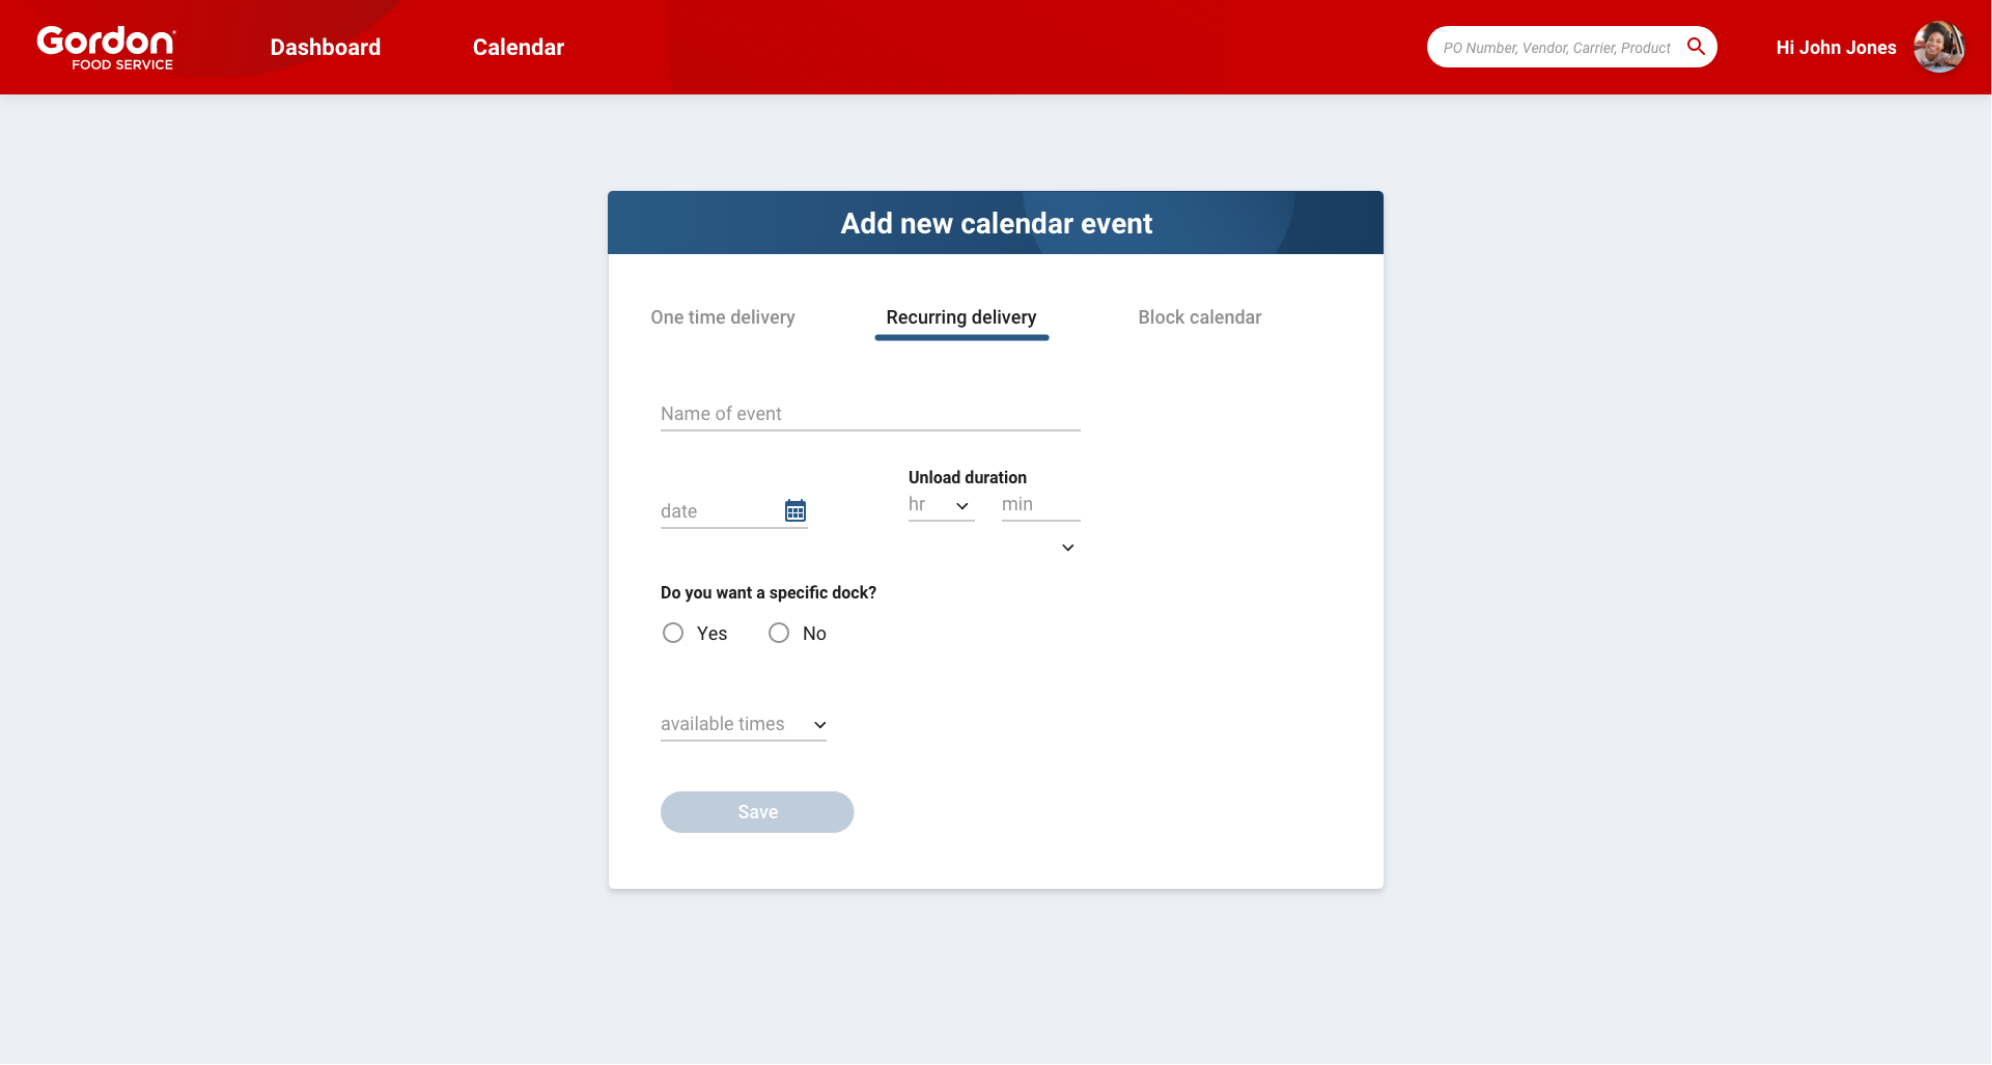
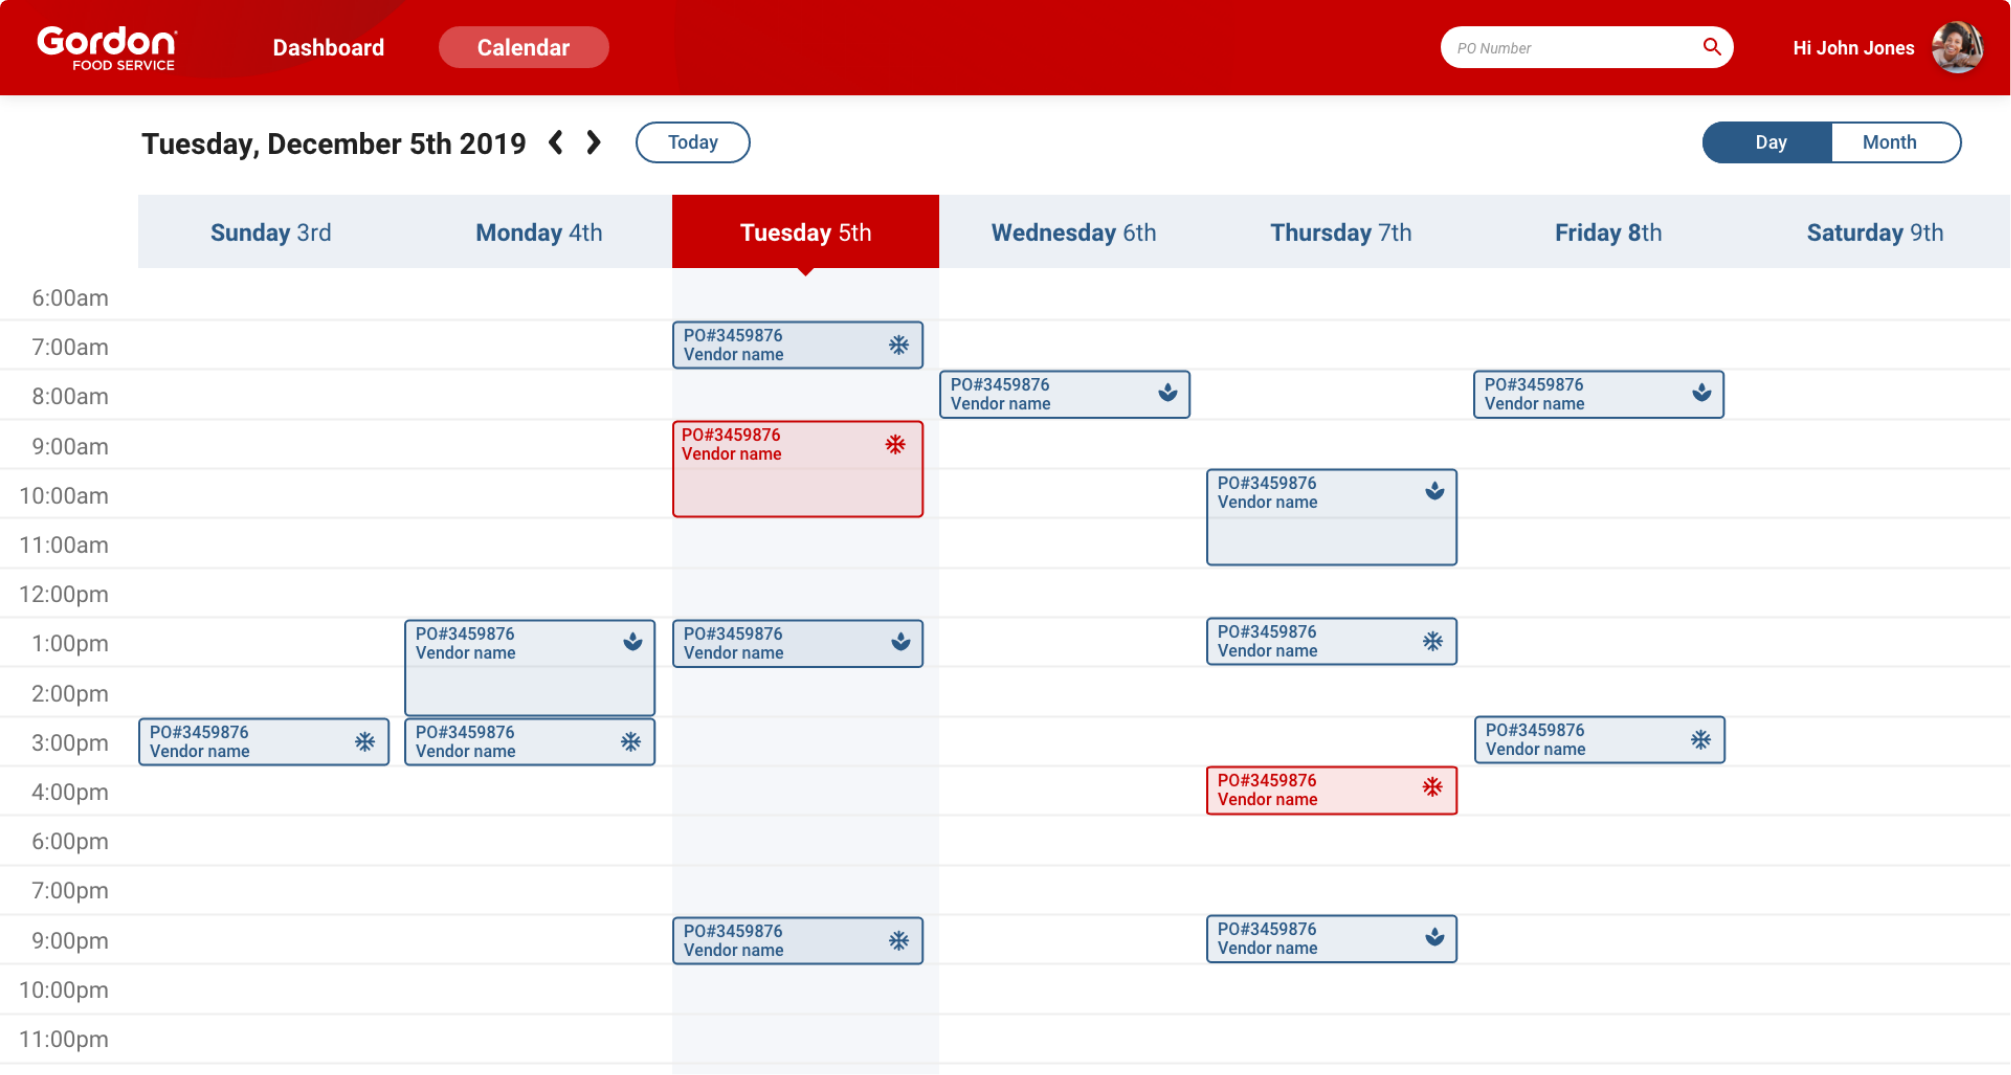
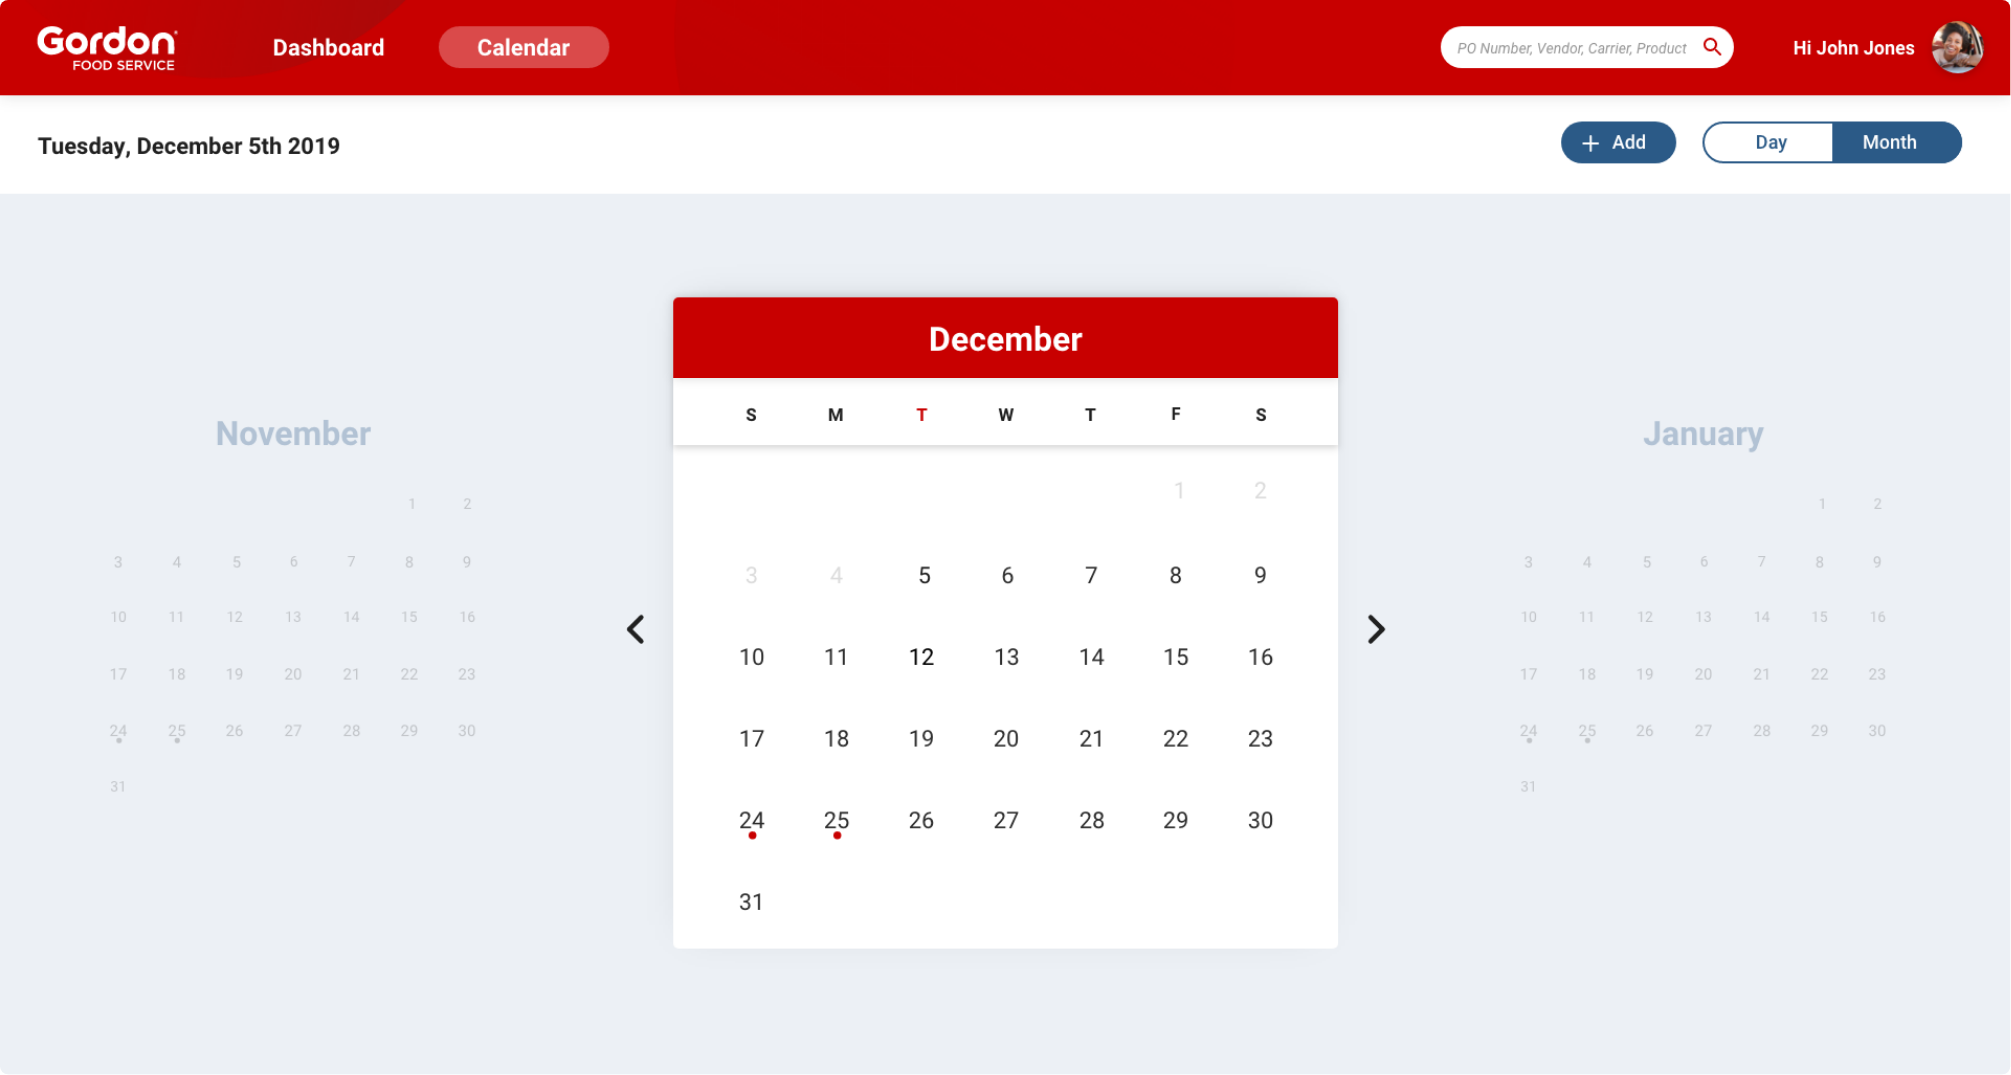
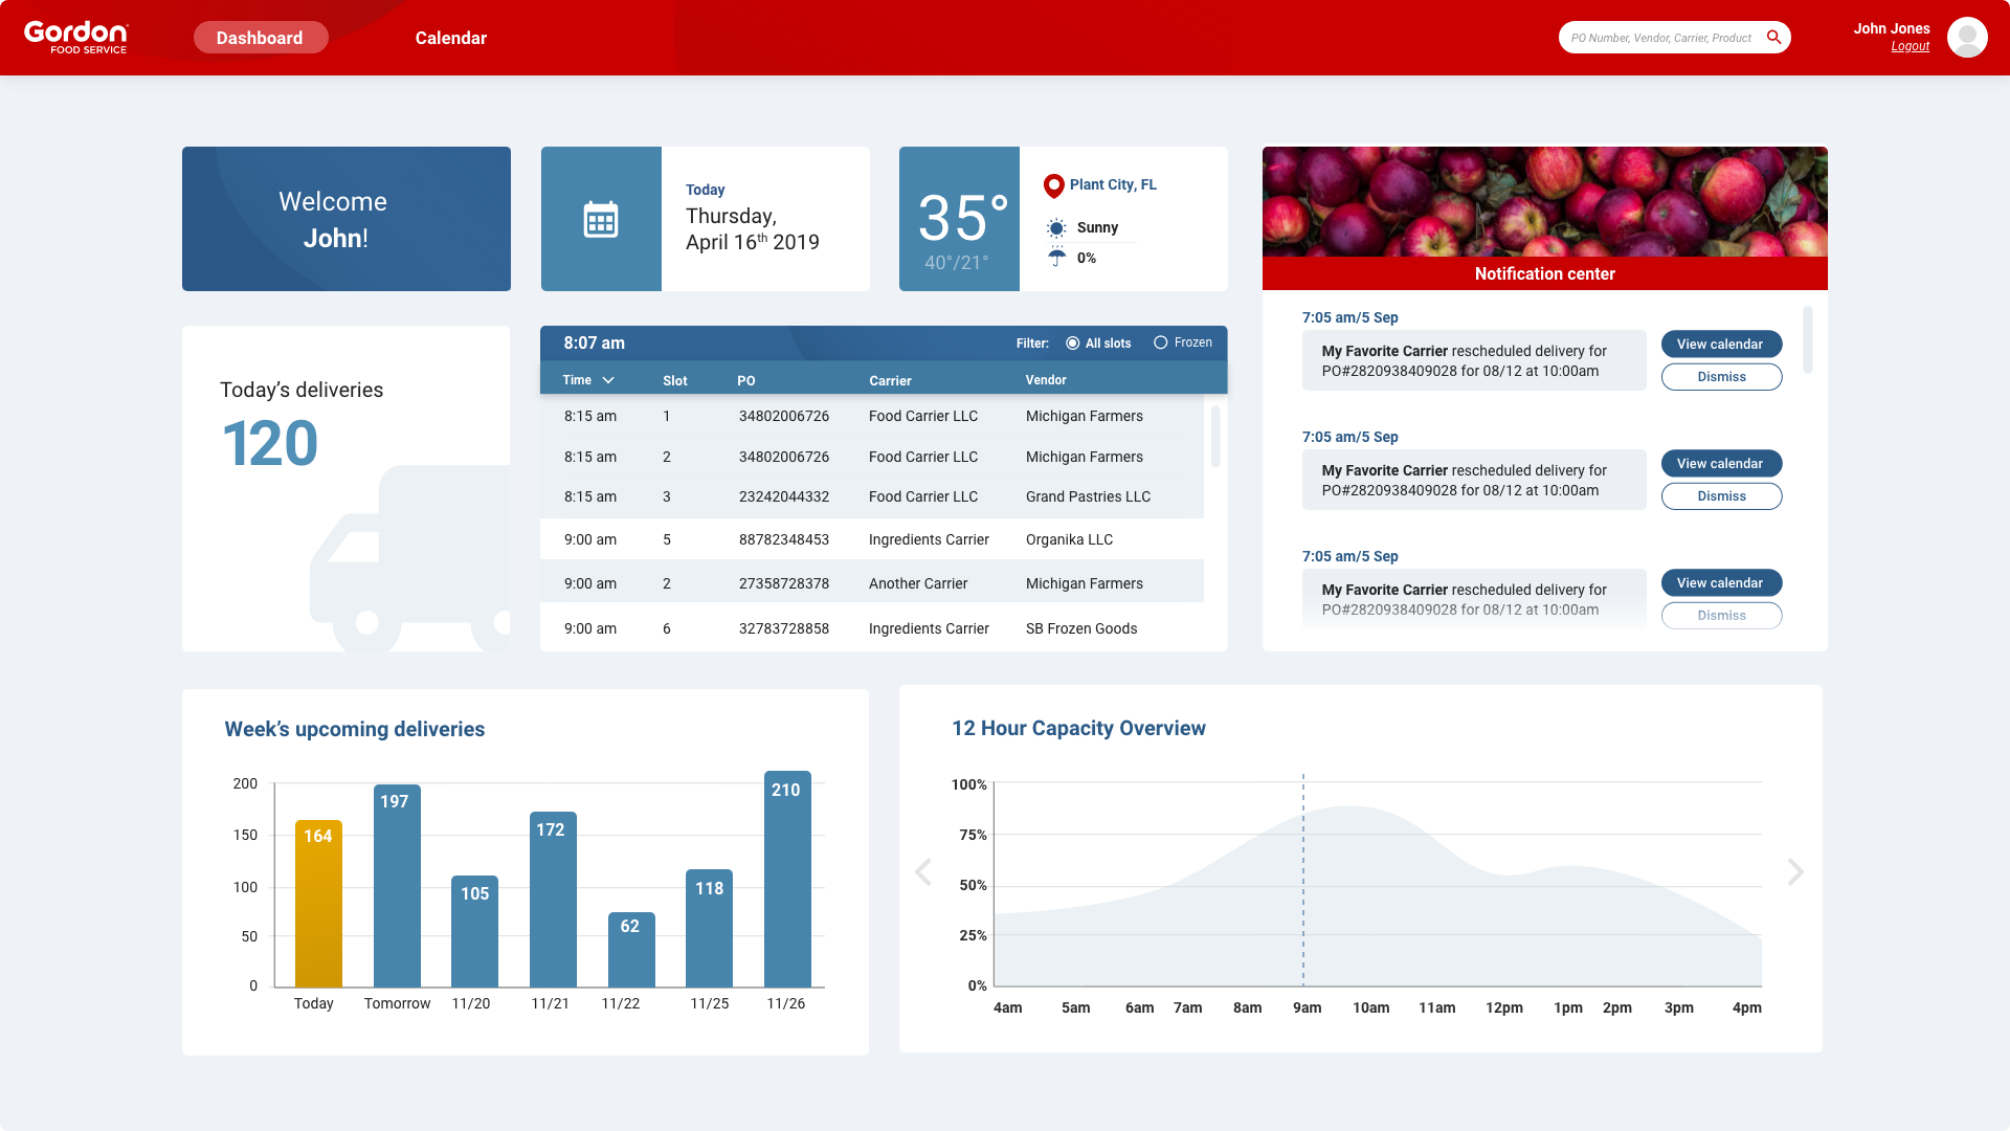
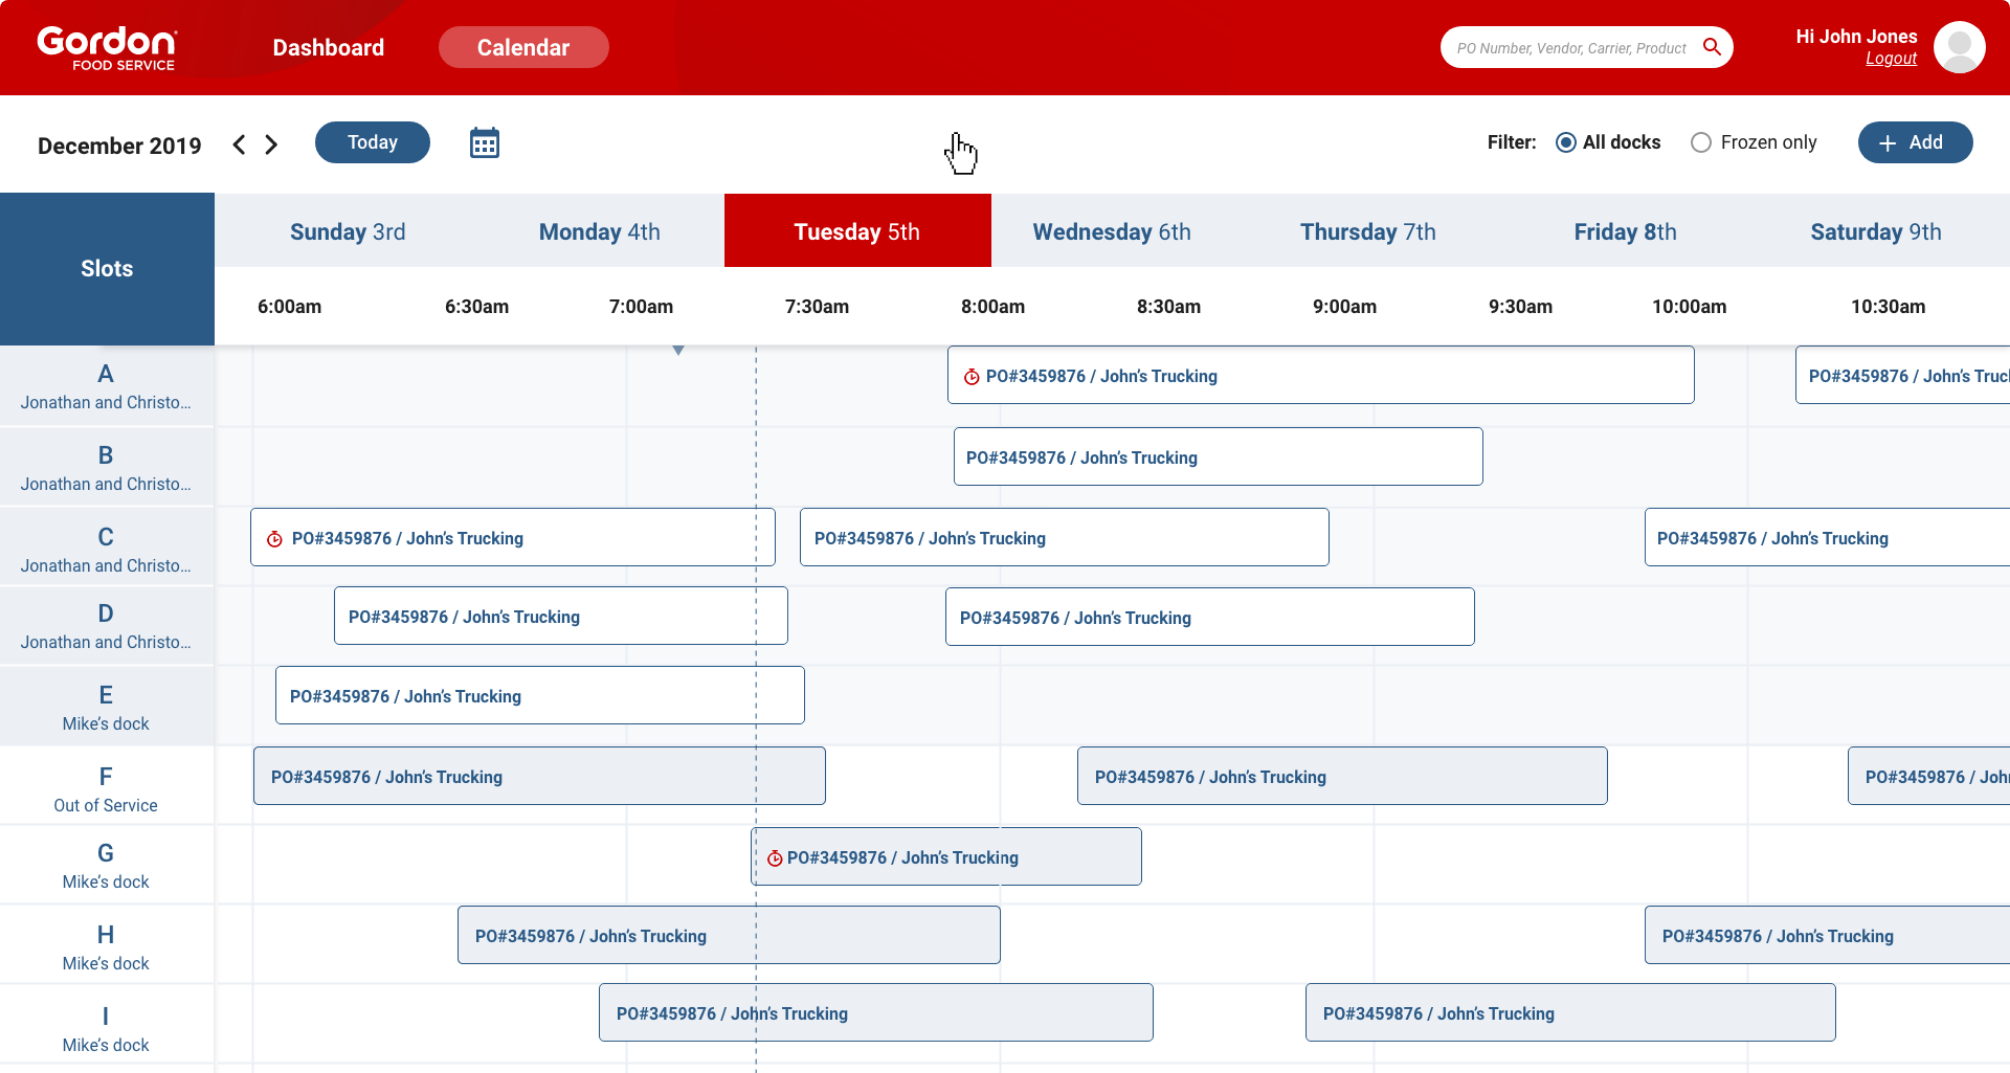
These are some of the screens from the initial prototype we created.
Step #5: Test
Feedback
After presenting the prototype to the client and after the client shared it with its employees and carriers, we got feedback. Some of the feedback included:
Client dashboard page:
1. Show dock number in the live event updates. Also, quickly show if dock is a “frozen” dock.
2. Show weekly capacity in dashboard.

Client scheduler page:
1. Usually docks are pre-assigned to employees. Add employee names for easy identification.
2. The rescheduled icon looks alarming. Update the rescheduled icon.
3. The zoom in/zoom out is not bring a lot of value

Based on this feedback, we created highly requested features like adding notes to a work order or a dashboard with actionable items. We also iterated the layout and copy slightly to increase visibility and clarity.

Disclaimer: Since this project was done through an agency, having continued feedback to keep improving the app after it was released was not budgeted. The team and the clients were very happy with the end results, however, I do believe that an iterative process is the key to a more successful product.
Lessons learned
A simple but valuable lesson learned from working with a client in a UX agency is the importance of expectation management. Clients may have evolving ideas or assumptions about the process, so setting clear expectations early—about timelines, deliverables, and the iterative nature of design—helps prevent misunderstandings. Regular check-ins and transparency about progress ensure alignment and build trust, making collaboration smoother and more productive.
